If you’ve been reading these pages for long, you know that my Facebook advertising strategy is focused on targeting those who are closest to me. I decided to take myself outside of this comfort zone recently, and it led me to a better understanding of a major problem with Facebook ads optimizationThe Performance Goal is chosen within the ad set and determines optimization and delivery. How you optimize impacts who sees your ad. Meta will show your ad to people most likely to perform your desired action. More.
Let’s take a closer look at that experiment and how I used current data to solve the problem…
The Experiment
I run 15 Facebook ad campaigns for each stage of the funnel:
- Traffic
- List Building
- Sales
Up until recently, I mostly avoided interest and Lookalike AudienceLookalike audiences allow advertisers to reach people who are similar to an audience of people already close to you. Lookalike audiences are based on custom Audiences, which tend to include your current customers or people who have engaged with your business. More targeting, even at the top of the funnel.
I could do this because I have a large audienceThis is the group of people who can potentially see your ads. You help influence this by adjusting age, gender, location, detailed targeting (interests and behaviors), custom audiences, and more. More of people who visit my website. The success rate when targeting this group of people provides little motivation to expand beyond it.
But if I would use such “cold” audiences, it would be at the top of the funnel. In theory, I could spend more to target people who don’t (but possibly should) know me with helpful content, slowly bringing them through to eventually register and buy.
One place in particular where this could be helpful was when promoting my content for entrepreneurs. I don’t have as large of an audience on that topic as I do for Facebook ads. So I could spend more money while targeting interests to introduce these people to my content. And if successful, I may even try to go straight for an opt-in.
With the help of Audience Insights, I isolated a group of entrepreneurship interests to target when promoting a blog post that may appeal to that group. To help uncover which would be most effective for my audience, I broke them into separate ad setsAn ad set is a Facebook ads grouping where settings like targeting, scheduling, optimization, and placement are determined. More.
- 4-Hour Workweek interest
- Gary Vaynerchuk interest
- Marie Forleo interest
- Tim Ferriss interest
- Other “general” entrepreneurship interests
The Results
It didn’t take long to find a clear top performer. Following are the costs per link clickThe link click metric measures all clicks on links that drive users to properties on and off of Facebook. More for each ad set (remember that my goal with this campaignThe campaign is the foundation of your Facebook ad. This is where you'll set an advertising objective, which defines what you want your ad to achieve. More was driving traffic):
- 4-Hour Workweek interest: $.25
- Gary Vaynerchuk interest: $.06
- Marie Forleo interest: $.16
- Tim Ferriss interest: $.31
- Other “general” entrepreneurship interests: $.14
Those Gary Vaynerchuk results were insane. The cost was even better than what it costs me when targeting people who visit my website and read an entrepreneur post (tends to be between $.10 – $.20).
Maybe I struck gold here. Maybe there’s something to this audience. So I also targeted this interest when promoting a free video series for entrepreneurs with a Facebook lead ad.
The results were startling. I quickly got 593 leads at $.29 per lead.
That cost was so good that it was half of the cost I am getting when targeting my readers of entrepreneur posts ($.58) — and that cost is pretty freaking good, too.
This discovery shook me and everything that I thought I knew about Facebook advertising.
Too Good to Be True?
A part of me knew to be skeptical from the start. This doesn’t make sense. But another part of me wanted so badly for it to be true that I tried to ignore it.
Finally, I dug deeper. Something just isn’t right here. Could these results be too good to be true?
The one thing that I wanted to check was geography. Where are the people from who are registering for this video series? Is it consistent with the geography of those who visit my website, subscribe, and ultimately buy?
The short answer: Uh oh…
Using the BreakdownBreakdown is a way to get insights into your ad performance related to time, delivery, action, or dynamic creative element. More feature within Facebook ad reports, I was able to uncover where these registrations were coming from.
Here’s a look at the top 12 countries:
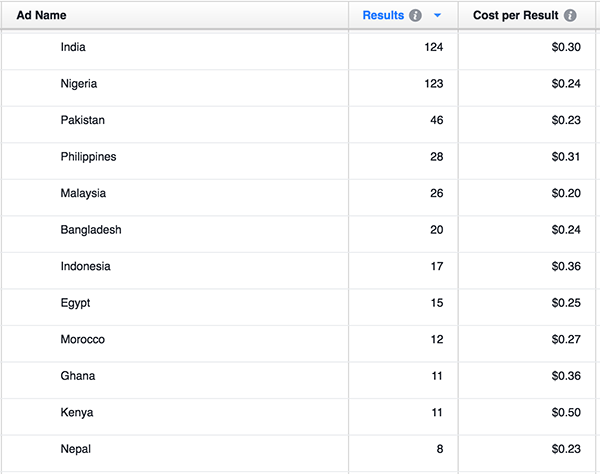
There are four countries in particular that are missing from this list. I typically see high volume of traffic from the United States, United Kingdom, Canada, and Australia. So, how many registrations are from those countries?
- United States: 0
- United Kingdom: 0
- Canada: 0
- Australia: 0
Not a single registration from those countries. But it’s not because the people in these countries weren’t converting. Facebook wasn’t even trying.
The highest spend for these four countries came from the United States, at a grand total of $.21. Not a particularly solid sample size.
This was alarming, to say the least. This also coincided with a higher volume of spam to these ads than is typical. Way higher.
Typically, I would have greater faith in conversion results. However, we’re dealing with Facebook lead ads here, and one weakness of that ad unit is that it’s insanely easy to convert.
However, I also don’t like to be too presumptuous regarding where my customers may come from. I decided to dig deeper to uncover where people are from who visit my website, register for something, and buy a product.
Maybe more people from these countries are buying from me than I think. It’s possible that this is a time to re-think everything.
Who Is Visiting My Website?
By far, the largest chunk of my traffic comes from the United States, at 30.1%. Here are the only countries that represent at least 4% of my website traffic:
- United States: 30.1%
- United Kingdom: 7.6%
- India: 6.2%
- Australia: 4.1%
- Canada: 4.1%
At this point, the inclusion of India in my conversion results isn’t completely crazy, but the exclusion of the other four countries certainly would be a head-scratcher.
Who is On My Email List?
It’s also possible that the composition of those who visit my website and are on my email list is different. So let’s take a closer look at that, too.
Interestingly enough, the composition of email subscribers isn’t much different…
- United States: 31%
- India: 8%
- United Kingdom: 6%
- Australia: 5%
- Canada: 4%
I can’t help but think that this campaign also padded these numbers a tad for India.
Who Are My Customers?
The end goal is to get sales, after all. So I want to see if I’m wasting my time with people from particular countries who subscribe to free content.
Here are the only countries representing at least 4% of my sales:
- United States: 52.9%
- Australia: 9.0%
- United Kingdom: 8.9%
- Canada: 5.7%
My audience from the United States is far more likely to buy from me. Interesting.
But what happened to India? Registrants from India make up 8% of my email list. Yet, only 1.2% of purchases is composed of customers from this country.
If you’re curious about the other countries that represented registrations for that test ad set, here you go:
- Nigeria: 0.1%
- Pakistan: 0.1%
- Philippines: 0.1%
- Malaysia: 0.8%
- Bangladesh: 0.0%
- Indonesia: 0.5%
- Egypt: 0.1%
- Morocco: 0.1%
- Ghana: 0.0%
- Kenya: 0.0%
- Nepal: 0.0%
The 12 countries that made up 74% of my registrations for this ad set make up a total of 3% of my sales.
Of the countries above, India is the only one that represents a reasonable amount of traffic. But even in that case, those who visit from India are far less likely to purchase.
Here’s a comparison of purchase to visit ratios for India, along with the other top traffic countries:
- Australia: .10 purchase vs. visit ratio
- United States: .09
- United Kingdom: .06
- Canada: .06
- India: .01
In other words, a visitor from Australia is 10X more likely to purchase than a visitor from India. Even in the case of Canada and the United Kingdom, that rate is 6X higher.
The Problem With Facebook Ads Optimization
Facebook’s goal when optimizing for leads is to get the most leads for the lowest price.
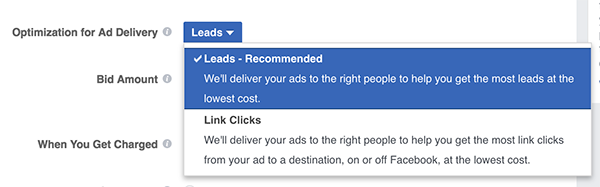
Quality is not part of the algorithm. Only cost and volume.
This may be less of an issue for a conversion that results in a sale. The value of those conversionsA conversion is counted whenever a website visitor performs an action that fires a standard event, custom event, or custom conversion. Examples of conversions include purchases, leads, content views, add to cart, and registrations. More is much more clear and obvious.
This may also be less of a factor when remarketing. Assuming, of course, that the bulk of your traffic and email list isn’t built on an audience that resulted from a campaign like this one, your results should be more controlled.
SIDE NOTE: All the more reason to focus primarily on remarketing if you can.
But when targeting interests and lookalike audiences, in particular, Facebook will naturally focus on clicks (when optimizing for traffic) and leads (when optimizing for leads) for the lowest cost. And those lowest cost leads and clicks, for me, come from countries that do not typically lead to sales.
How to Fix This
The fix should be quite obvious: We need to filter using countries that tend to be most productive for our business.
For me, it’s the four countries mentioned earlier (United States, United Kingdom, Canada, and Australia). However, I’ve also added countries that have a .05 purchase-to-visit ratio while also providing decent volume.
I updated my ad sets to only include these countries. The results, as you can imagine, are quite different.
The cost per website click for the ad set promoting a blog post to the Gary Vaynerchuk audience went up from $.06 to $.32. Obviously, not nearly as effective — and a cost that wouldn’t be worthwhile for me.
The cost per lead for that same audience increased from $.29 to $1.79. While that rate is significantly higher than targeting my website visitors, it’s at least within the right ballpark to watch it for a while longer.
Your Turn
This experiment provides a couple of primary lessons:
1) Be skeptical of results that appear to be too good to be true. Dig deeper.
2) Don’t assume anything. Research customer composition to better understand your results.
Anything you’d add here?
Let me know in the comments below!