There was a time when Facebook ad reports were a secret among the most knowledgable advertisers. This goldmine was buried behind sublinks and very few advertisers benefited.
But since Facebook redesigned Ads Manager, the ad reports are now front and center. You can no longer avoid them. And it’s imperative you understand how to use them so that you, too, might benefit.
Let’s take a closer look at five of the ways advertisers like you need to be using Facebook ad reports…
[Tweet “Facebook ad reports are powerful, but are you using them in these five ways?”]
1. Filter by Objective
If you’re like me, you’re constantly running multiple campaignsThe campaign is the foundation of your Facebook ad. This is where you'll set an advertising objective, which defines what you want your ad to achieve. More of varying objectives. At minimum, I’m running both “Clicks to Website” and “Website Conversions” campaign objectivesWhen you create a campaign, one of the first things you'll do is select an objective. The campaign objective is your ultimate goal. Your selection will impact options, including optimization and delivery. Options include Awareness, Traffic, Engagement, Leads, App Promotion, and Sales. More.
It’s important to separate the results for the two. If I’m driving traffic for a popular blog post, I can expect to get a very low cost per website click. But if I’m promoting a product, I know that cost to get a website click will be higher — often by multiples.
Similarly, if I want to compare conversion campaigns, I don’t want my results to be diluted by campaigns that were run simply to drive traffic. They need to be separated.
That’s when filtering by objective comes in handy. At the top right of Ads Manager, click “Filters” and expand “Objective.”
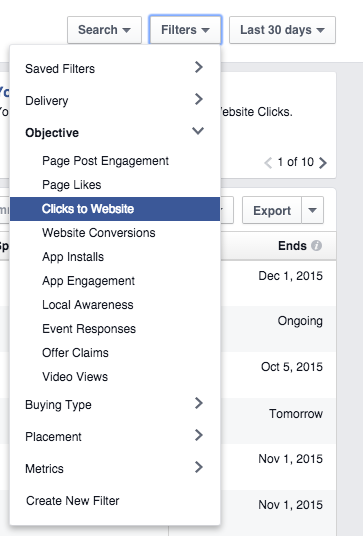
For the purpose of this exercise, let’s select “Clicks to Website.” But as you can see, you can do this for any campaign objective — and you should for all that you use.
Next, within filters, expand “Saved Filters” and select “Had Delivery.”
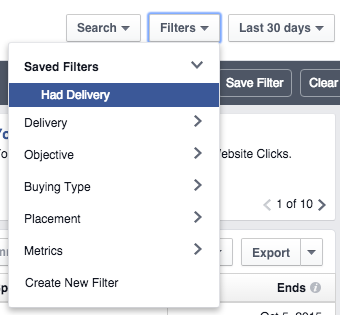
You can also replicate this by expanding the “Metrics” filter, selecting “Impressions” and enter greater than 0.
You should also select a time period that makes sense. Let’s go with “Last 30 Days” for now.
Here is what the filter bar looks like at the top left…

Now let’s make this report a little more useful for tracking website clicks.
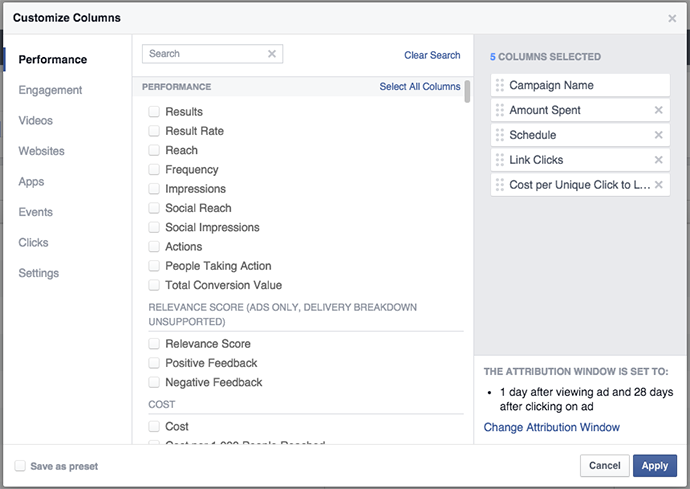
Click the “Columns” drop-down on the right and select “Customize Columns…”
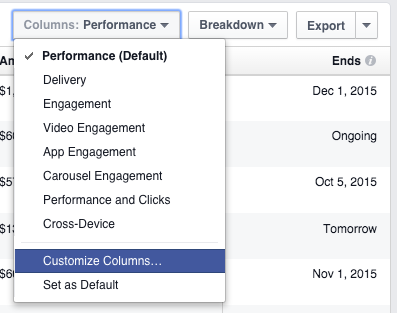
Add and remove columns so that you end up with only what we are shown here (on the right side)…
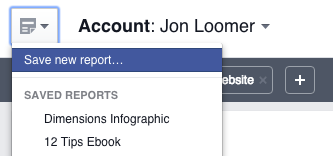
Now it’s time to save this report so that you can use it later. Click the document icon at the top left and select “Save new report…”
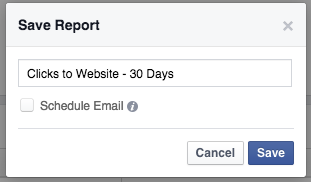
Name it something logical based on the campaign objective and click save…
You should repeat this process for all objectives you use. Then you can easily access performance reports based on specific objectives.
2. Breakdown by Placement
Most advertisers make a lot of assumptions around placementA placement is a location where your ad is shown. Examples include Facebook's mobile Feed, Messenger, Instagram feed, Audience Network, right-hand column, and more. More. They assume they should only run ads in the news feed, for example. But is this true?
While you could create ad setsAn ad set is a Facebook ads grouping where settings like targeting, scheduling, optimization, and placement are determined. More based on placement, this isn’t always necessary. You could run ads to all placements but break down results within your ad reports. Here’s how…
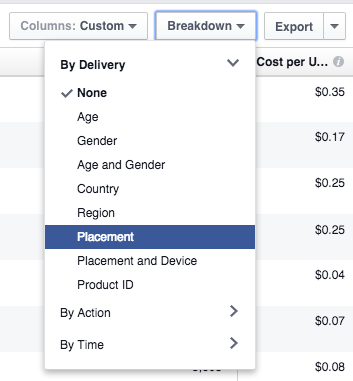
Within the “Breakdown” drop-down at the right, expand “By Delivery” and select “Placement.”
Facebook will now break down the performance of each campaign by placement, providing an individual row for the following that apply:
- News Feed on Desktop Computers
- News Feed on Mobile Devices
- Audience NetworkAudience Network is a network of mobile apps that have been approved to monetize their apps with ads. This is how you can show your Meta ads to people while they are away from the Meta family of apps. Audience Network and associated groups are among your placement selection options in the ad set. More on Third Party Mobile Apps
- Right Column Ads on Desktop Computers
- Right Column Ads on Home Page for Desktop Computers
Here’s an example…
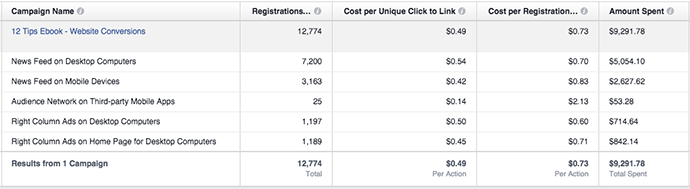
This campaign was for my 12 Tips ebook, where the objective was a conversion. Anything surprise you here?
While mobile devices have the cheapest cost per website click (other than AudienceThis is the group of people who can potentially see your ads. You help influence this by adjusting age, gender, location, detailed targeting (interests and behaviors), custom audiences, and more. More Network, which is a very small sample size), the cheapest conversionsA conversion is counted whenever a website visitor performs an action that fires a standard event, custom event, or custom conversion. Examples of conversions include purchases, leads, content views, add to cart, and registrations. More actually came from desktop. In fact, right column was my top performing placement.
Back to the topic of Audience Network, although it’s a small sample size we see that I likely get accidental clicks. While those website clicks are very cheap, the conversions certainly are not.
We can take this information and make some adjustments.
1. Remove Audience Network. It barely ran anyway, and wasn’t particularly effective.
2. Create separate ad sets by placement. While not required, this would allow me to better control ad spend by placement, thereby focusing a bit more on desktop than mobile — without eliminating mobile entirely (which I would not want to do).
3. Breakdown by Country
You may create ad sets that target multiple countries within them. Or you may even target Custom Audiences with no country filtering. So how do you determine which countries perform best?
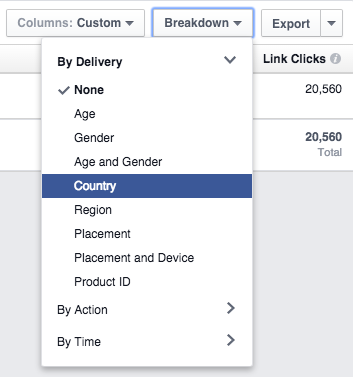
Within your ad reports, click the “Breakdown” drop-down, expand “By Delivery” and select “Country.”
Here’s an example of performance of that same campaign by four different countries…
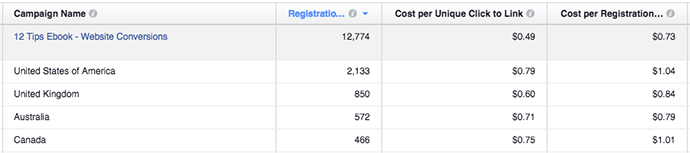
Here you can see that it’s a bit more expensive to get conversions in the United States and Canada. Additionally, Australians are more likely to convert after clicking a link (evidenced by the minimal difference between cost per website click and cost per conversion).
I could apply these learnings to either filter the countries I target or create separate ad sets by country and control my spending.
While we won’t go into it today, also note that you can break down performance by region. In the United States, for example, you can see how your advertising is performing by state.
4. Breakdown by Carousel Card
CarouselA carousel allows you to display two or more scrollable images or videos in the same ad, with the ability to link each to a different URL. More ads are a great option for advertisers. They provide the ability to feature multiple image links within the same ad, like this…
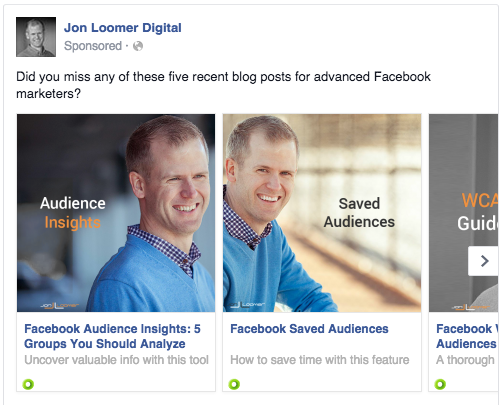
So, how do you find out which of those links drove the most clicks?
Click that “Breakdown” drop-down on the right, expand “By Action” and select “Carousel Card.”
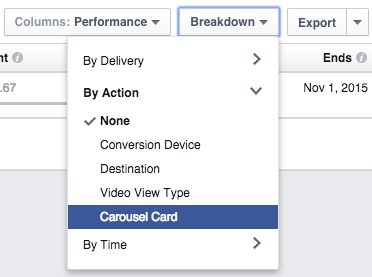
Make sure that one of the columns in your report is for link clicksThe link click metric measures all clicks on links that drive users to properties on and off of Facebook. More. Then you’ll be able to compare the number of clicks on each image/link.
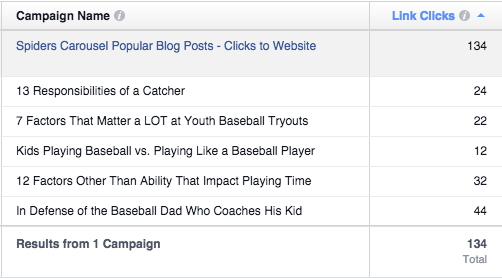
The title represents the headline you used for each link. In the example above, you can see the clear differences in clicks. The top performing link got nearly four times as many clicks as the lowest performer.
What do we do with this? Well, you could then update that carousel ad to only include the top performers. Or you could simply replace the lowest performer with different content.
5. Breakdown by Destination
When I run ads, I like to track all active conversion pixels, no matter the objective. I may promote a blog post, for example, but those who read that post may end up subscribing to my ebook. I’d like to know that!
So, other than tracking those pixels, how do you see this information in your reports?
Within the “Breakdown” drop-down on the right, expand “By Action” and select “Destination.”
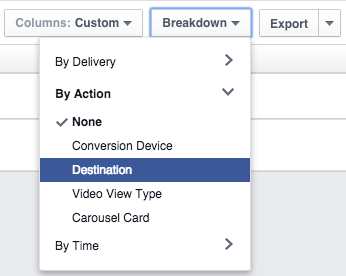
You’ll also want to be sure to customize your columns to include columns for link clicks and relevant conversion types.
Back to that 12 Tips ebook campaign example, here is how it breaks down by destination…
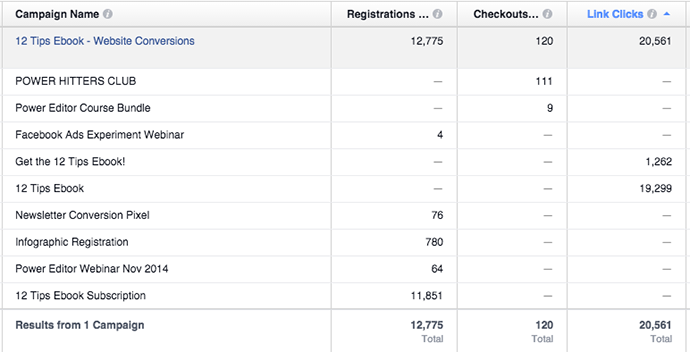
Note there are separate entries for “Get the 12 Tips Ebook!” and “12 Tips Ebook.” That’s because there were different ads with these two different headlines. That’s why those are what generated the link clicks.
Everything else represents the conversion pixels I was tracking. While my objective was to drive conversions for an ebook (there were 11,851!), note that I got far more than that. I also got conversions on four other opt-ins (totaling 924) while selling 111 Power Hitters Club memberships (!) and nine Power Editor course bundles.
If we assume even a very conservative average sale price of $300 for those products, that’s $36,000 in revenue for a campaign that was only meant to collect email addresses.
Most advertisers would have focused only on the objective conversion and never would have known the true value of this campaign. Don’t be “most” advertisers!
Learn More About Facebook Ad Reports!
This is just a sampling of some of the powerful things you should be doing with Facebook ad reports. I will be hosting a live, virtual workshop on Monday, October 5 at 5pm EDT to exhaust the topic!
In this two hour event, I will spend one hour talking about ad reports and another hour discussing Audience Insights. There will also be time for Q&A.
Your Turn
Do you use ad reports in these ways? What other filters and settings do you find useful?
Let me know in the comments below!