If you’re a Facebook advertiser, one of the most underutilized features that you may not even know about is the Custom Metric. I wrote about it two years ago, and it’s an option that largely escapes advertisers.
I want to take a second look at custom metrics today and provide two specific examples of how I use them.
What Are Custom Metrics?
I don’t want to reinvent the wheel by writing another tutorial on custom metrics here. But, it’s important that you understand what we’re talking about.
Custom metrics allow you to combine metrics in a formula to uncover information that Facebook won’t provide natively. You can create custom metrics in either your custom ad reports or within Ads Manager itself. Where you create the custom metric doesn’t matter. The actual process is the same and those metrics can be used across both locations.
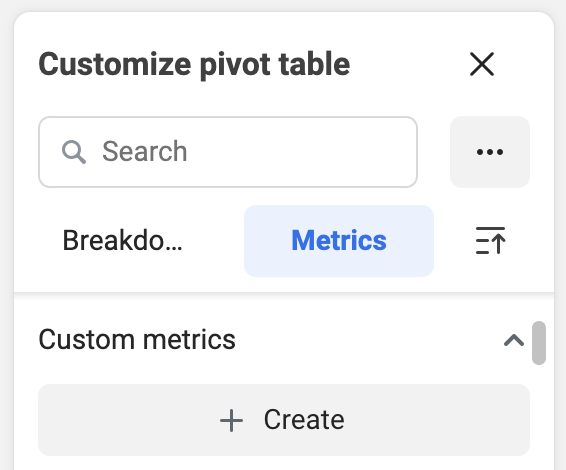
Within custom ad reports, you’ll see the option within “Metrics” on the right…
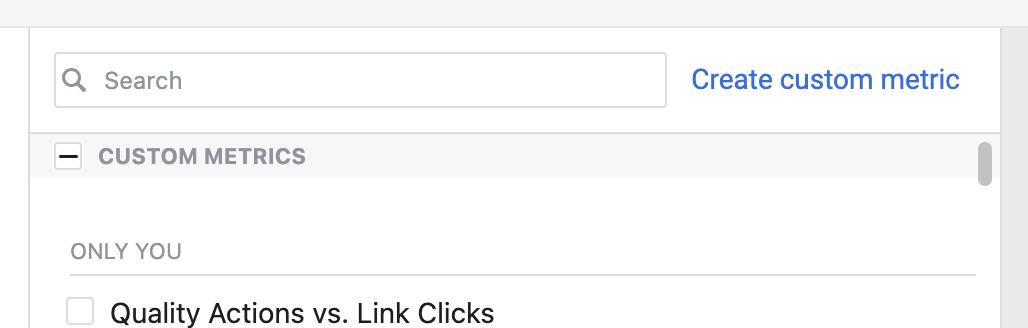
And within Ads Manager, you can see the option to create a custom metric when you customize columns…
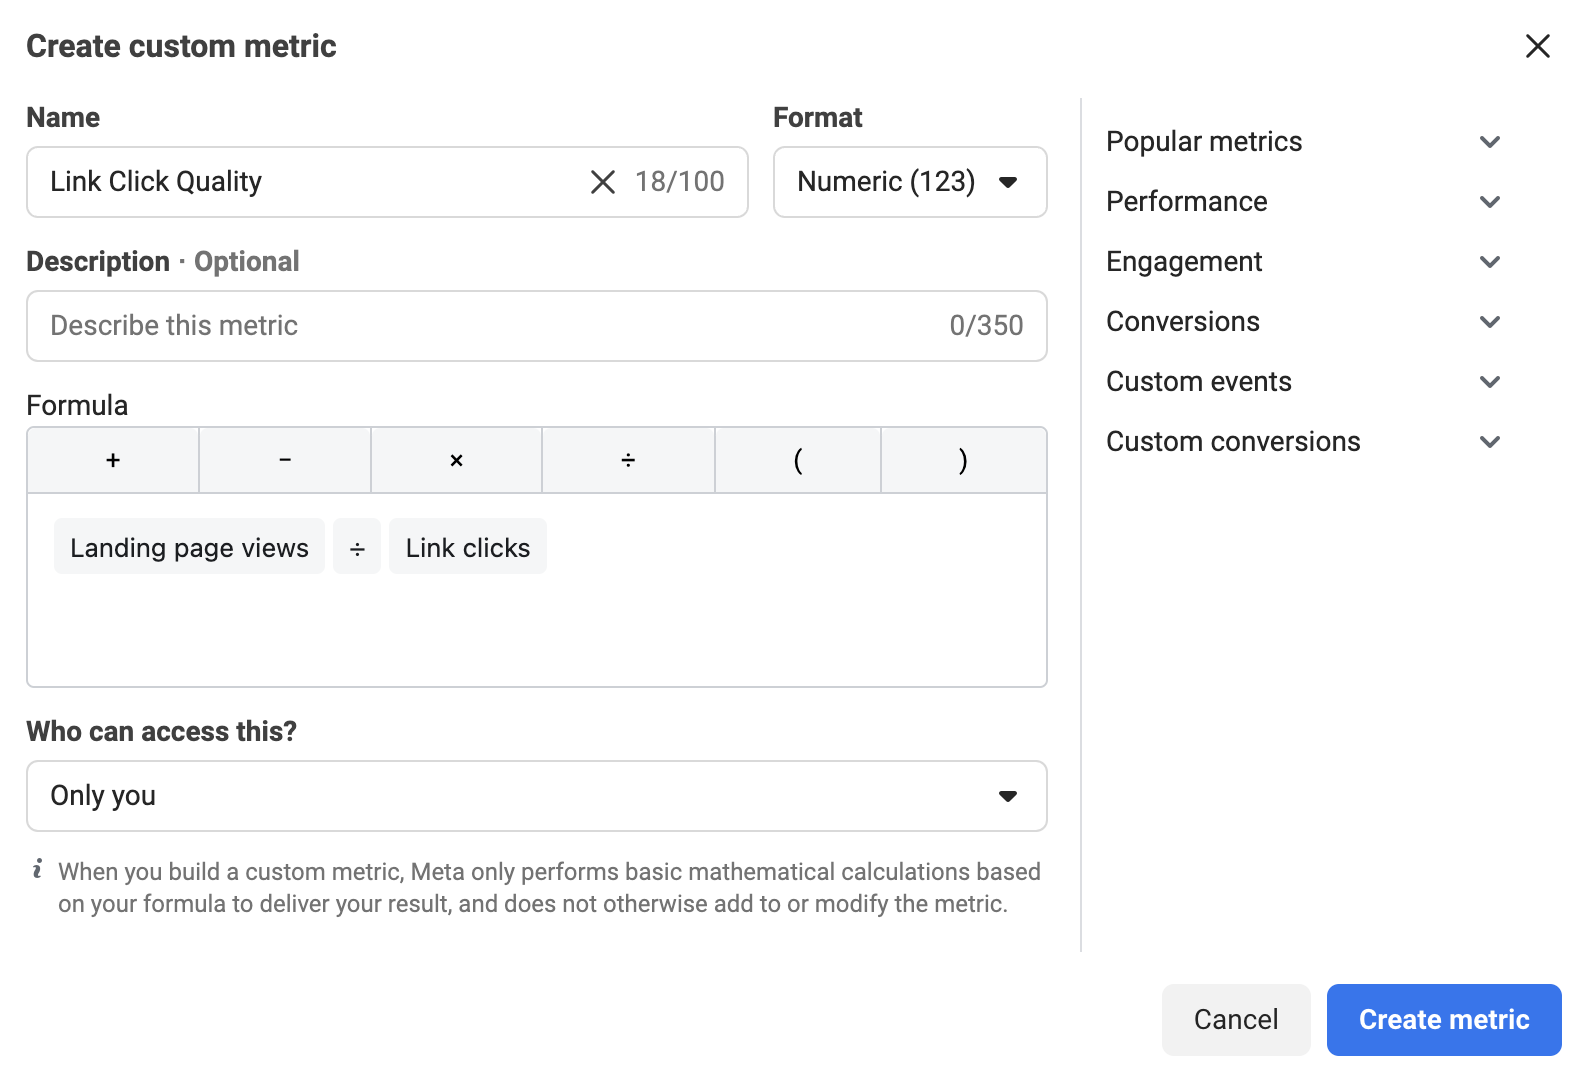
Here’s a really simple example. You may want to monitor the quality of traffic you’re sending by calculating the ratio of Landing Page Views over Link Clicks.
You can then select these custom metrics when adding columns to your report.
Why Would You Use Custom Metrics?
Before we get to a couple of examples, let’s dig a little deeper into why custom metrics are important.
There are times when the metrics available don’t provide the necessary insight that you need. This can be critical to properly evaluate the performance of a campaign.
The metrics that you use and care about most should be simple in many cases. For example, if you are optimizing for a purchase, you should care most about the number of purchases, the cost to get those purchases, and maybe the ROAS. These metrics are all built-in.
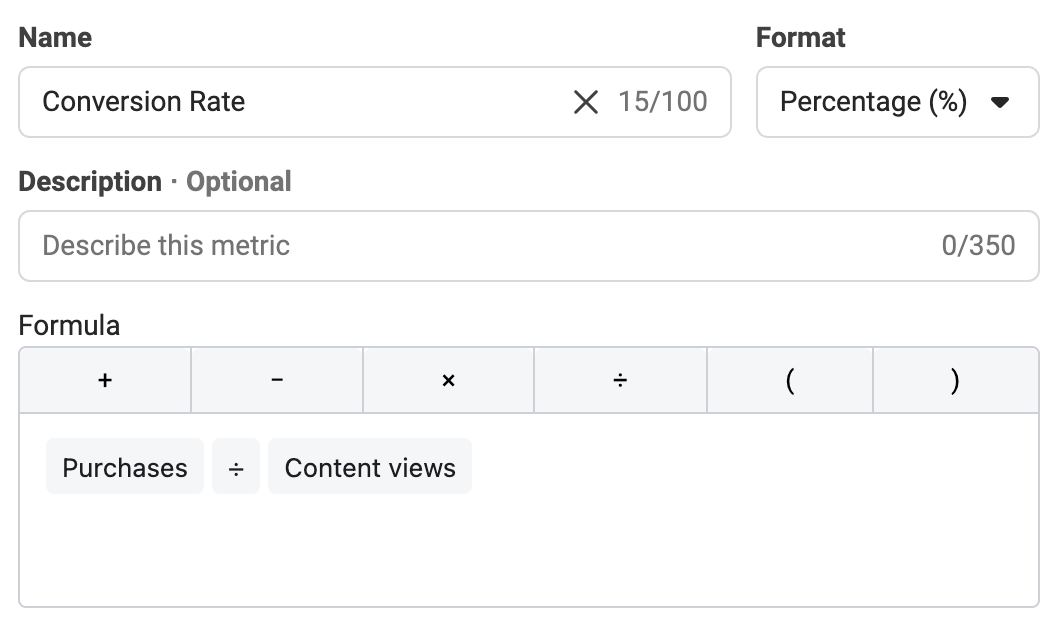
But, what about if that campaign isn’t effective? Is it due to the conversion rate? Facebook offers some metrics like Result Rate and Conversion Rate Ranking, but they don’t provide a rate for the number of Conversions compared to View Content, for example. This would show the number of people who converted over those who hit the landing page.
The most glaring need for custom metrics, though, is related to efforts to drive engagement and traffic.
Engagement Score
If you run an engagement campaign, you’ll likely optimize for something like Video Views or Post Engagement. Post Engagement as a metric, though, includes multiple metrics that are treated equally.
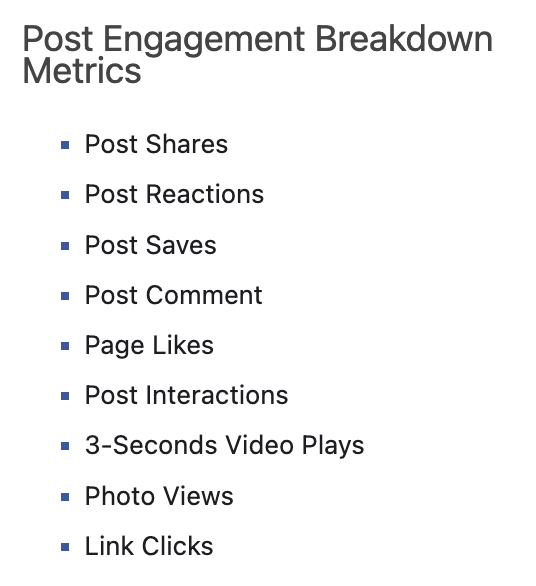
We don’t want that. We know that some metrics are more important than others. A Share, for example, can lead to many more people seeing your post. A 3-second video view could be due to auto-play, which may have no impact on the user.
So, we can create a formula that weights each type of engagement differently. Of course, how we weight each type of engagement is somewhat arbitrary, and it will be different from advertiser to advertiser. Here’s an example of what you might use for a Post Engagement Score:

In this example, I combine several prioritized engagement metrics and apply different weights based on what I think is most important. I then divide that sum by the total spent.
Here’s a summary of weights:
- Page Likes or Followers (5)
- Messaging Conversations Started (4)
- Post Shares (3)
- Post Saves (2)
- Post Comments (1)
- Post Reactions (1)
- Video Plays at 95% (1)
I used amount spent because the cost to get all of these things is more important to me than the actual rate. But, how you build these custom metrics is completely up to you.
Traffic Score
One of my biggest peeves with Facebook is that there is so little focus on driving and measuring quality website traffic. If you rely on Facebook’s metrics alone, the “Result” which determines success will be link clicks or landing page views. But, what if we created a custom metric that better reflects the quality of that traffic?
From a basic level, you could build a custom metric based only on the information that Facebook provides (landing page views and standard events). I’m not going to include bottom-of-the-funnel metrics like purchases in this case because the primary focus here is on traffic actions (but do what you want).
But, a custom metric can get really interesting if you use custom events like I do. Here’s an example of a custom metric that I built to measure the quality of traffic…
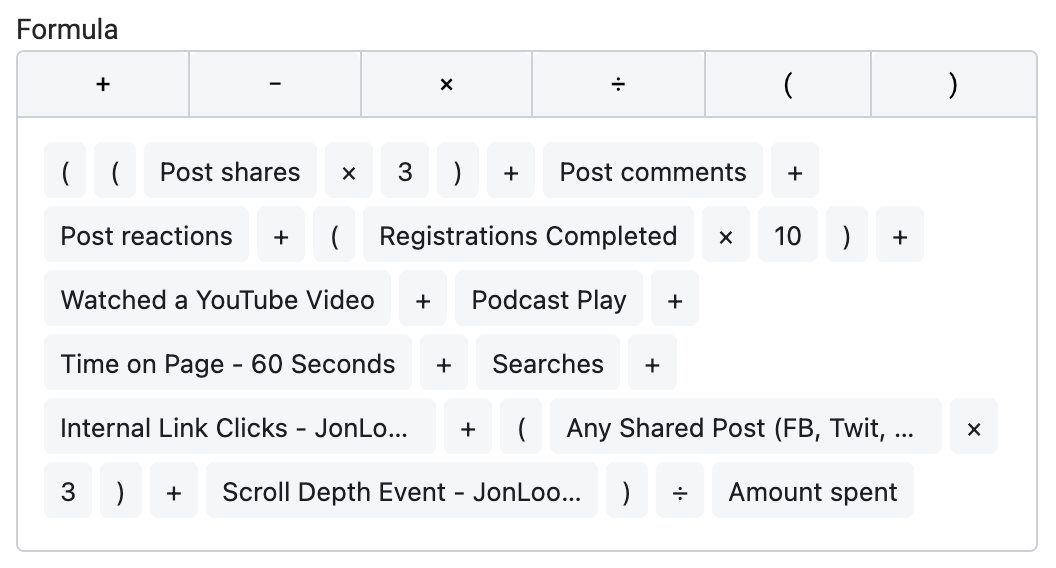
Here’s a breakdown of the metrics I’ve used and their weights:
- Registrations Completed (10)
- Post Shares (3)
- *Any Shared Post (3)
- Post Comments
- Post Reactions
- *Podcast Play
- *Time on Page – 60 Seconds
- Searches
- *Internal Link Clicks
- *Scroll Depth Event
- *Watched a YouTube Video
Notice I’ve included some on-post engagement that I find important like shares, comments, and reactions. Everything else occurs on the website itself.
The metrics marked with an asterisk (*) are all custom events that I’ve set up. So, I measure when someone clicks to share directly from my website to Facebook, Twitter, LinkedIn, or email. I also measure media plays (podcast player or embedded YouTube video), internal link clicks, time spent, and scroll depth. I include the Searches standard event, as well.
All of these things, in my mind, reflect a quality website visitor. I can certainly add columns to my Ads Manager reporting to include each metric (and I do). But, it’s incredibly helpful to include a column for one score that accounts for all of them.
I manage different websites that utilize different custom events. Because of this, I create unique Website Engagement Score metrics for each one.
Watch Video
Your Turn
Do you create custom metrics? What are some examples?
Let me know in the comments below!


