What should your Facebook ad frequency be? This is a common question among Facebook advertisers, and a source of discussion in the Power Hitters Club groups.
As with many aspects of Facebook, there’s not a one-size-fits-all approach. But, that does not mean you cannot consider the ideal frequencies for your own advertising. This article provides a general guide for approaching this important issue.
Facebook Ad Frequency Defined
Facebook defines frequency as the average number of times each person saw your ad. It’s important to note that this is an estimated metric. This means that it’s not always an exact number.
Remember that (Impressions divided by Reach) = Frequency. Said another way, (Reach multiplied by Frequency) = Impressions. This formula will come in handy later.
It’s also important to remember that Facebook ad frequency is an average. You may have some people in the audience who were reached a very large number of times, and others who were reached only once. The overall average is what Facebook reports. If you want to dive into deeper detail on frequency distribution, I’ve written about this topic in an article about Page-Level reporting.
Determining Frequency
Within Ads Manager, Facebook has a functionality that allows us to include Frequency metrics in any reporting view: Campaign, Ad Set, or Ad Level.
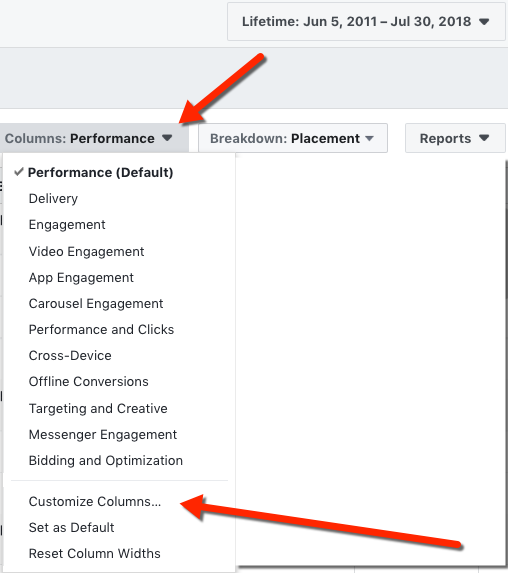
From the top right of Ads Manager, you should have a button called “Columns: Performance” listed below the date range.
If you select this button, you can select “Customize Columns” to add a variety of data points to the export:
From here, you can select Frequency from the metrics available. On the right side of the selector, you can also “slide” the metrics up and down the list to change the order in which they appear:
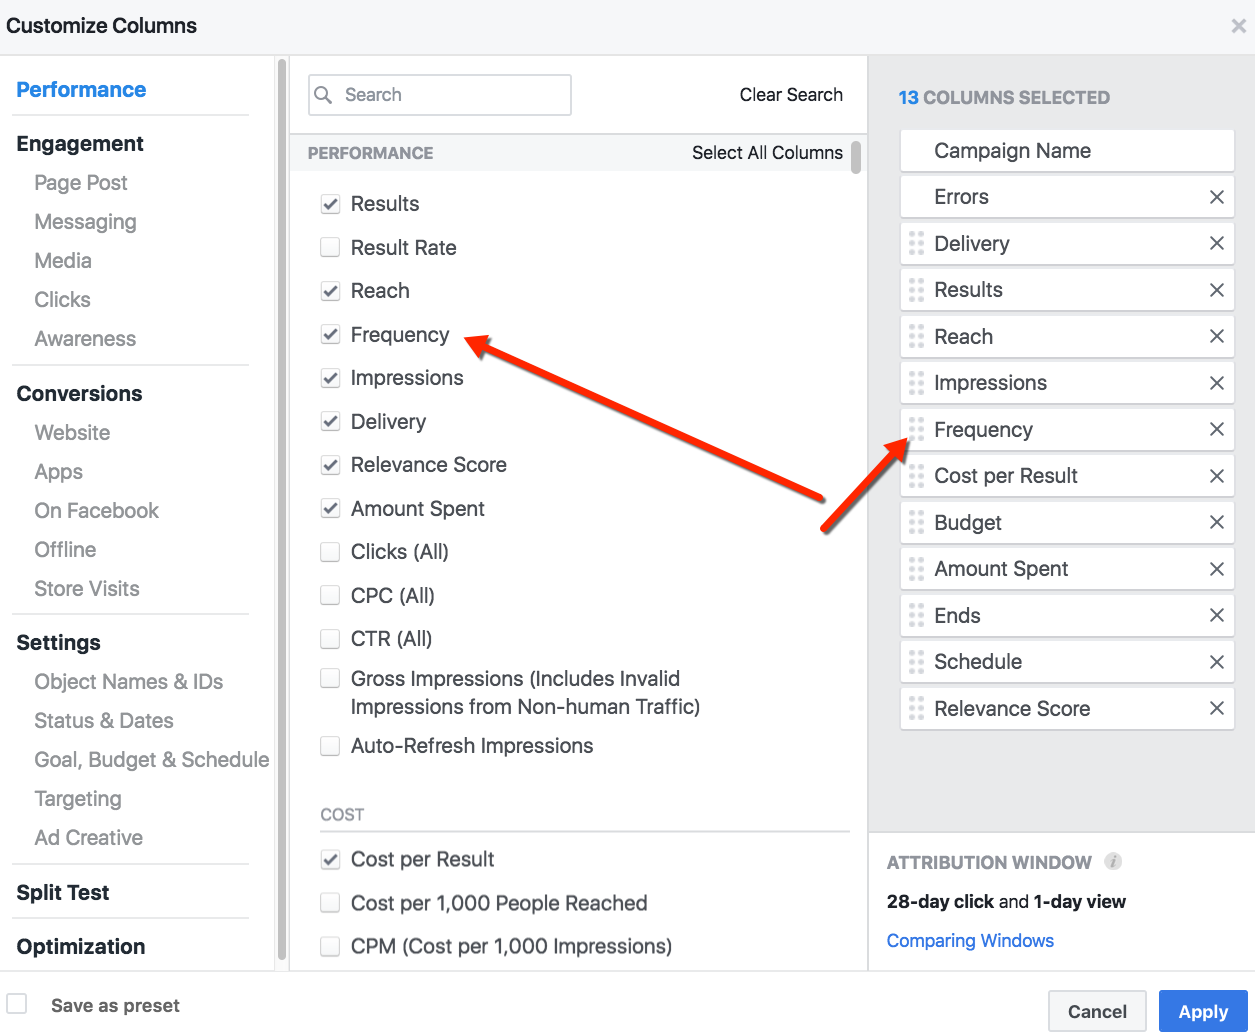
I like to place Reach, Impressions, and Frequency adjacent to one another, as these three metrics are directly related.
Now that we have added Frequency to the reporting view, let’s look at an example to illustrate the math involved:
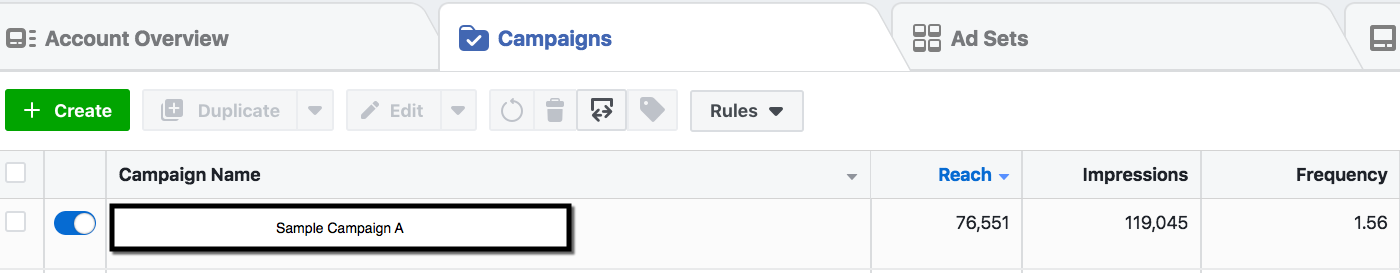
Using our formula, we can see that (119,045 / 76,551) = 1.56. That is, Impressions divided by Reach equals Frequency.
Daily Frequency Breakout
Using the Charts functionality of Ads Manager, we can also look at Daily Frequency for a specific campaign.
Here’s how we find this data point.
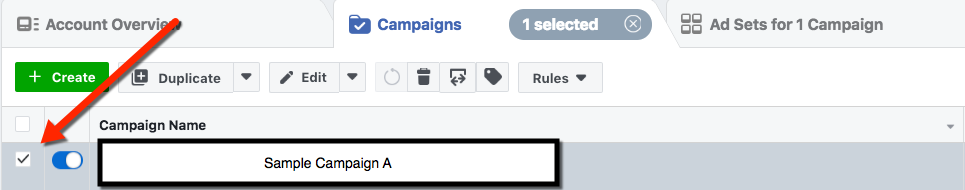
1) Select the Campaign from the list of campaigns.
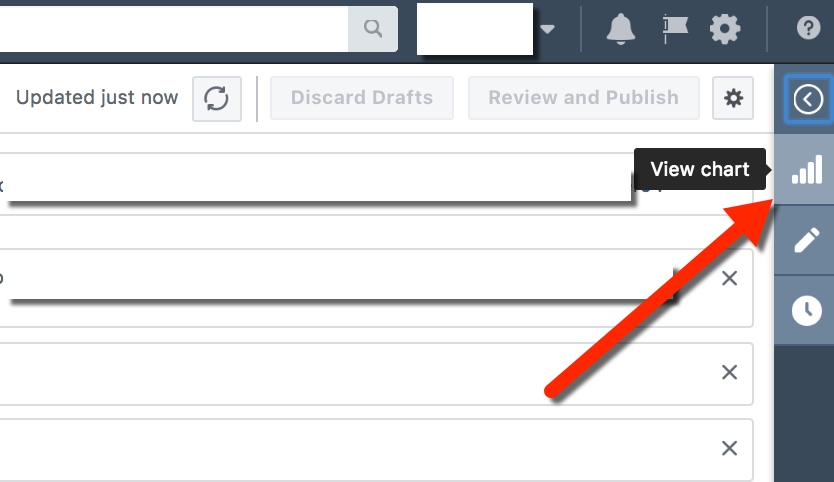
2) Select the “View Chart” button from the top right of Ads Manager.
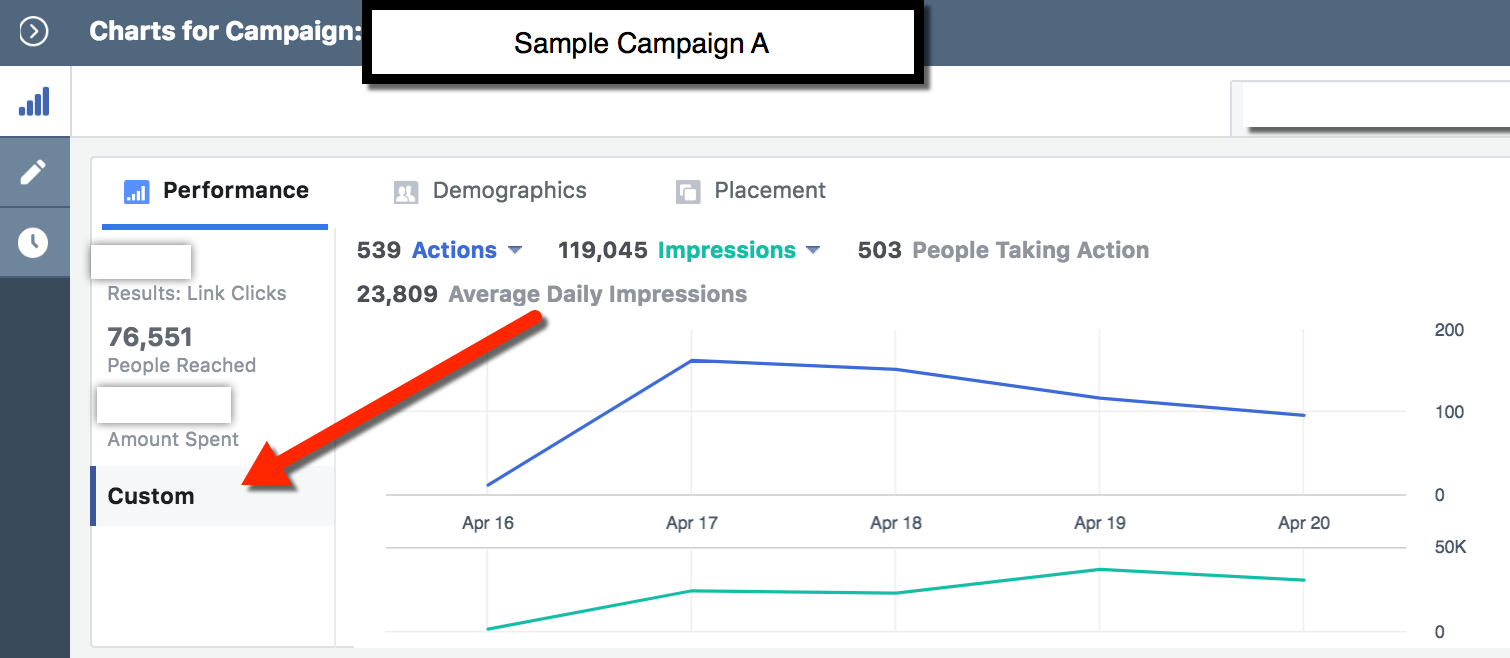
3) Click on the “Custom” button (depending on your default view, you may not need to do this step, or step 4)
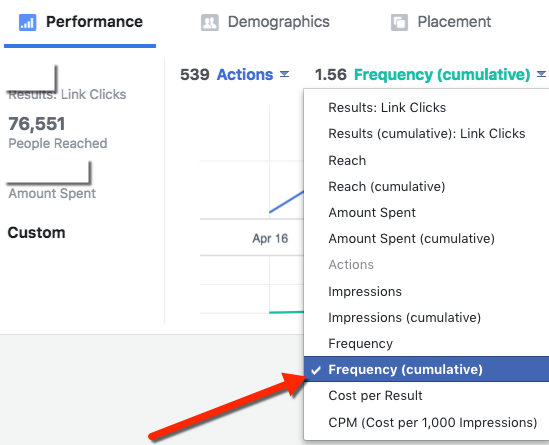
4) Change “Impressions” to “Frequency” in the drop down in the center:
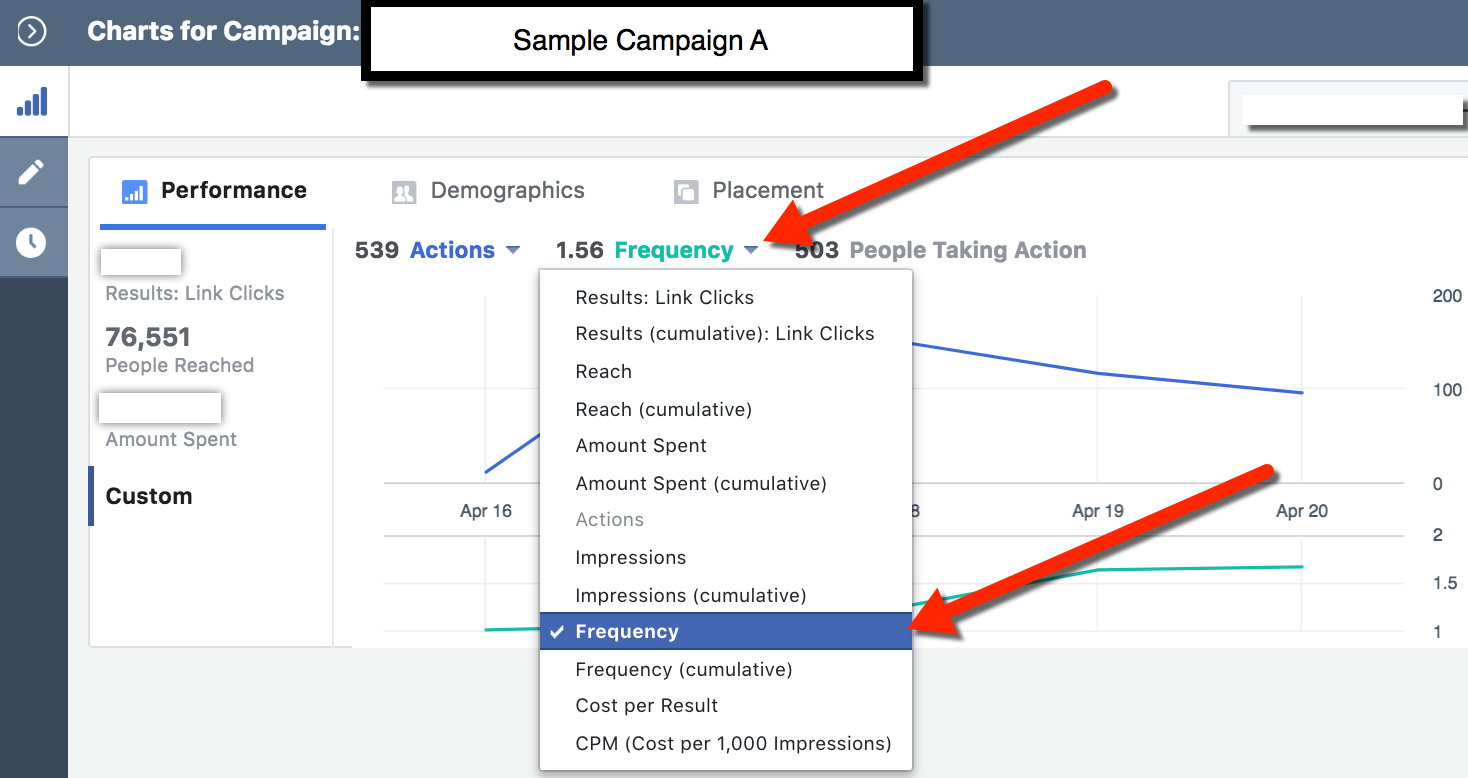
You will now see the overall Frequency for the selected reporting period, for the specific Campaign:

If you hover over a specific day, you will see the Frequency metric for that day. Here’s an example of what we would see if we hovered over April 18th from our sample data:
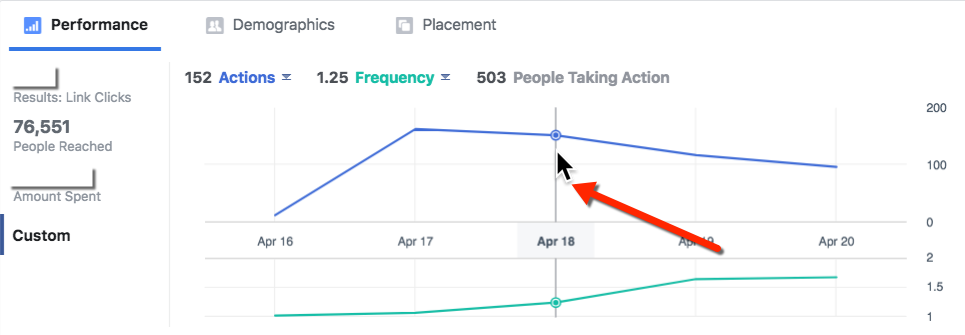
Notice that the frequency changed from 1.56 (our overall Campaign frequency for the reporting period) to 1.25 (our Campaign frequency for the specific date of April 18).
You can repeat the above process for an Ad or Ad Set. You can also do it for multiple Campaigns (or multiple Ad Sets, or multiple Ads), depending on your reporting needs.
If you are having trouble with navigating how to look at multiple Campaigns, Ad Sets, or Ads, check out my write-up on Paid Reach Reporting in Ads Manager where we covered this methodology.
Cumulative Frequency Breakout
We can also use the “View Charts” functionality to dive deeper into Cumulative Frequency.
Cumulative Frequency tells us how the frequency increased each day to accumulate for the campaign over time. This can be an indicator of how you began “saturating” the same audience over time. It can also show where you might have specific points of time in the history of a campaign when the same individuals were being shown ads.
Let’s look at our example again. We can change the Frequency indicator to Frequency (cumulative), as illustrated here:
You may notice that overall cumulative frequency for the reporting period is the same as the overall frequency. This is as expected, as the final cumulative frequency is an overall aggregation of the entire period.
The more interesting detail comes from looking at specific dates. Let’s look at April 18th to compare what the daily cumulative frequency was telling us for the same period:
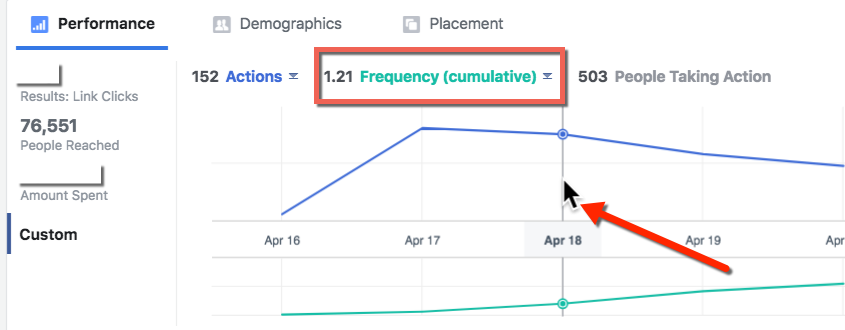
Notice here that the data is telling us our Cumulative Frequency is 1.21 for April 18, vs. 1.25 Daily Frequency for April 18th that we obtained previously.
At first glance, this seems impossible… How could we reach fewer people cumulatively, over time, than those whom we reach on a single day?
This can happen because frequency is an overall average, over time, for the period in question. Meaning – the average frequency on a single day could be higher than the average cumulative frequency for an extended period of time. You will likely see similar data points in your own campaigns, with specific dates having a higher average frequency than a multi-day period during the life of a campaign.
The above process can be followed for an Ad or Ad Set. You can compare it across multiple Campaigns (or multiple Ad Sets, or multiple Ads), depending on your reporting needs.
The Ideal Frequency
Now that we know how to look at our Frequency metrics, let’s discuss the big question: What’s an Ideal Facebook Ad Frequency?
Facebook has a very interesting analysis titled Effective Frequency: Reaching Full Campaign Potential. I definitely recommend you check this out, if the topic is of particular interest. If you’d like deeper detail of the analysis, they have a companion white paper where the methodology and implications are covered in more detail.
While the analysis from Facebook has a lot of content, my favorite component is their Frequency Factors Chart:
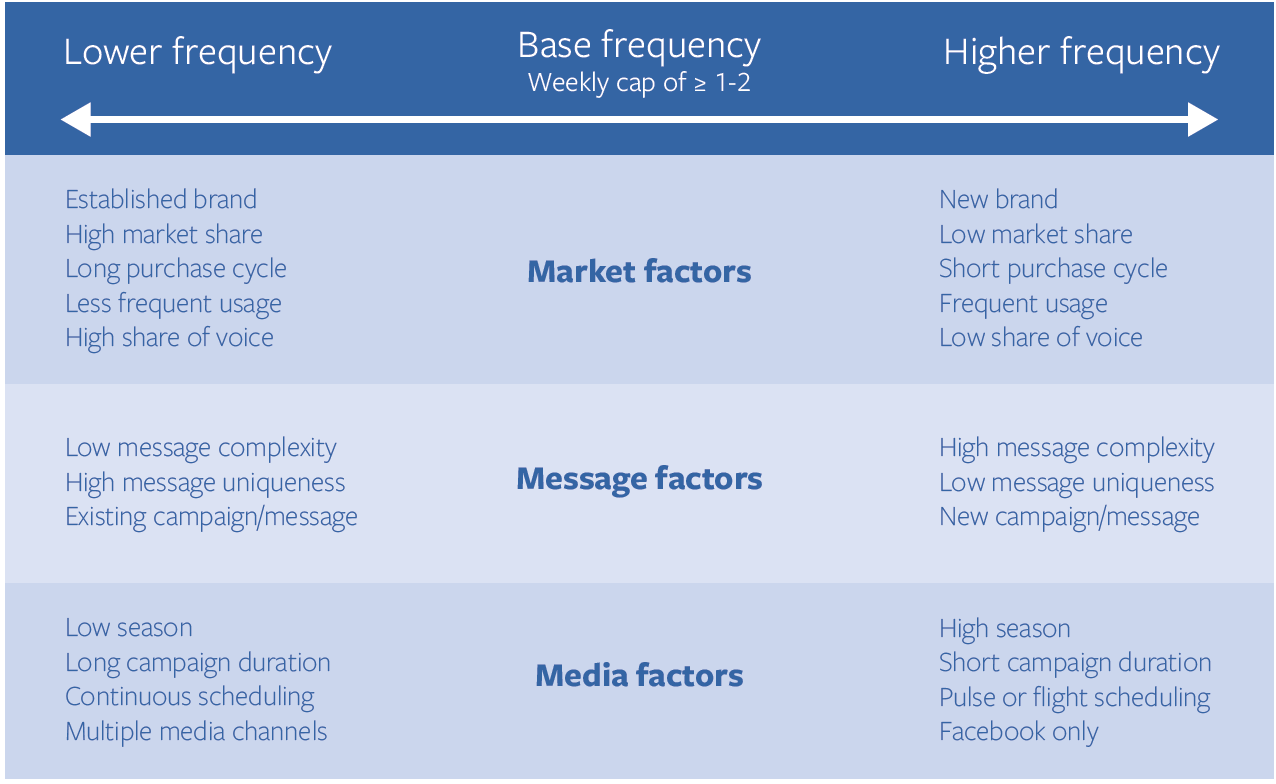
I consider this to be a compact, concise, and clear framework for thinking about when you may benefit from differing frequencies.
But to go even further, I believe there are some additional contextual considerations, which are also important when thinking about Facebook ad frequency. Let’s walk through these:
1) Variation in the Ad Creative
When you have highly similar creatives across your campaign, multiple exposures of the same imagery/copy (high frequency) can be an issue for your audience.
When there is larger variation between creatives, the high frequency can be less of a problem.
We can use a hypothetical example to illustrate. Let’s say we have 10 ads about basketball.
In a campaign with high creative variation, each ad might be about a different basketball team. Therefore, people who see multiple ads from the campaign might be less annoyed by each, since the ads are about different topics, likely featuring a different team logo or visual layout, etc.
In a campaign with low creative variation, there might be 10 images of the same team. They may all show a slightly different angle of the image, or slight variations in the text used. A user with exposure to several of these ads may perceive repetition. This user may more likely be annoyed if they are being shown your ads over and over. While you may consider each ad to be different, the casual user may consider them to be the same, because they look so familiar.
An important reminder on this: Even if you have many creatives in a campaign, they may not all be receiving impressions. This is due to Facebook’s ad delivery system favoring high performing ads. Remember that you can check impressions for each specific ad in a campaign (as well as the Reach and Frequency for each ad).
If you have a large number of creatives that are clearly different and they’re all receiving impressions, high frequency is far less likely to cause issues.
2) Consideration of Placement
Facebook’s study of effective frequency did not discuss consideration of ad placement. The placement of an ad is how your audience encounters your post, and can affect your results wildly.
For example, placements in Right Column can be very high compared with other placements such as Facebook News Feed and Instagram News Feed, without resulting in the same level of annoyance or frustration from the exposed audience.
Placements in the Right Column tend to be seen as less intrusive. They live in the “traditional ad space” where users might be accustomed to seeing ads in other website experiences. Of course, this placement also tends to be the least likely to drive engagement from your audience, which is why these are often at the lower cost of all placements.
Why is this important? If you are looking through your own ad results and you see a specific unit that has a very high frequency, the very first thing to check should be the placement breakdown. You can do this by clicking “Breakdown: By Delivery,” then selecting “Placement” to see the breakout of results:
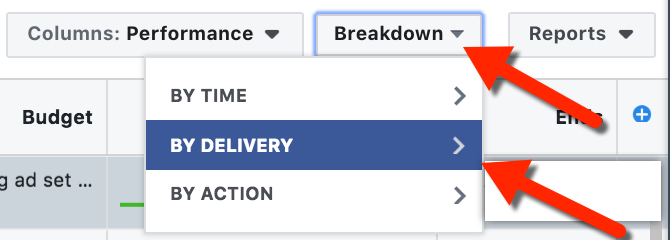
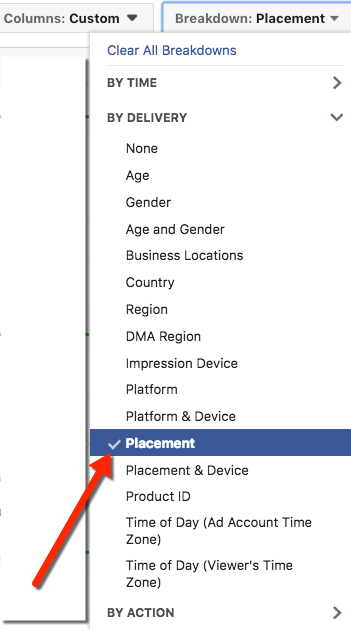
Once you’ve selected the breakdown, it should display something like this:
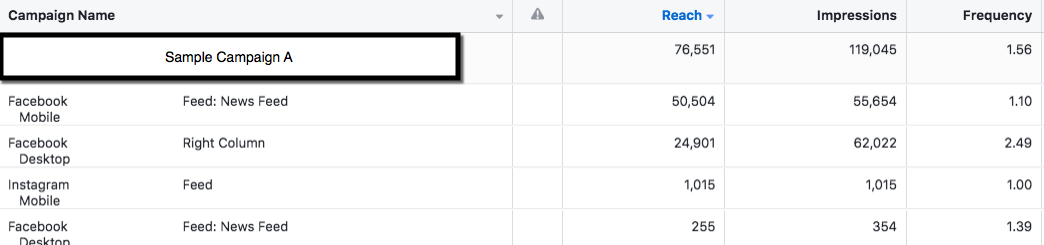
Notice in our example that average frequency for Desktop Right Column placement is much higher than other placements. This can sometimes skew the way a campaign appears to perform for overall frequency, because a higher volume of placements in Right Column may not be so problematic.
I often notice advertisers have high frequency for Right Column placements in cases where they have selected campaign goals that are more tied to eyeballs on ads – such as Reach, for example.
If your overall campaign objectives are more tied to specific action results, such as the Conversions or Video Views objectives, you’ll likely find that Facebook’s optimization system generally works to optimize the placement for the specific action you desire. Since Right Column placement tends to result in low ad interaction, you will normally see lower impression numbers for this placement (and therefore lower frequency), for such campaigns.
Is Your Frequency a Problem?
It can be tough to determine whether your frequency is the source of performance issues. Unfortunately, Facebook removed the Negative Feedback metric from Ads Manager reporting. This was once a great metric for considering the source of fatigue issues.
Fortunately, there are certain cases where you can still get an idea of negative feedback. Specifically, for published page posts that you are promoting, you can export Post-Level data and check two data points in particular: Lifetime Negative Feedback from Users and Lifetime Negative Feedback.
At the time of this writing, these are columns R and S in the Post-Level export. Negative Feedback from Users is a count of people who have given negative feedback. Negative Feedback is a measure of the times that negative feedback has been given.
These metrics can be a potential indicator that your frequency may be too high, though sometimes it can just be that the audience dislikes your ad. That said, it’s always important to look at this number in context as a proportion of your overall reach. As your reach increases, so will negative feedback. If the proportion of Negative Feedback from Users vs. Post Total Reach seems particularly high vs. your average, you may have a problem.
How to Control Facebook Ad Frequency
If you are concerned about your Frequency and would like to control it a bit more directly, there are options available.
1) Reach and Frequency Buying: You can use this option to define goals in advance. Specifically, the amount of people you want to reach, and how often you want to reach them.
There are some limitations to this tool. First, this option is not available to all advertisers. It’s a feature that Facebook seems to make available to advertisers with higher spend levels. Second, it “locks in” your results to the agreed upon amount. If you have content that has the potential to perform extremely well in the ad auction, you could have outperformed what the guaranteed results may have been, had you utilized this option.
2) Use the Reach Objective: This option allows you to set a maximum frequency on your campaign. However, there are many, many cases when I would not recommend using the Reach objective, such as when another goal is more likely to optimize to your specific results (as with Brand Awareness or Conversions, for example). I tend to use this objective only in very specific cases. Jon’s write-up on his structure of 15 Facebook Ad Campaigns included a few examples of where he uses Reach.
3) Using Automated Rules: You can set automated rules to take action on your behalf. You’ll find automated rules in Ads Manager, useful for when certain parameters (such as Frequency!) are met. Jon wrote about this feature in detail here.
4) Manual Monitoring: You can closely monitor your campaigns and simply make changes manually when frequency exceeds your comfort level. For example, you might lower budgets, expand the target, add new creatives, or simply pause Ads, Ad Sets, or Campaigns if it seems your audiences may be getting fatigued based on high frequency. However, keep in mind that certain actions reset the learning phase for your ads.
The Low-Down on Facebook Ad Frequency
You may notice there is no hard rule for frequency listed in this post.
As with many aspects of Facebook advertising, the ideal depends on your specific situation! The outlined approaches are intended to provide a guide for consideration. This will likely be far more effective than a single rule that does not consider the context or needs of your activities.
- You can monitor Frequency at the Campaign, Ad Set, or Ad Level
- High frequency is tied to audience fatigue and may impact your results.
- High frequency can be less of a concern when you have high creative variety, or for particularly high volume placements in your Campaign (such as Right Column).
- If you believe high frequency may be a problem for your campaigns, you have some options to control Frequency.
Your Turn
Do you consider Frequency in your performance analysis?
Let me know in the comments below!


