Facebook Reach is one of the metrics you hear about a lot when it comes to Facebook reporting. When we report on Facebook Reach, there are two main classifications to remember – Facebook Page Reach and Facebook Post Reach.
Facebook Page Reach tends to be the least troublesome of the two, so let’s start here first.
Properly understanding reach tends to be a source of confusion for many marketers, particularly when it comes to reporting on Organic Facebook Reach. I often see it arise in conversations with other members of the Power Hitters Club who are working on performance reports.
Jon has written about this metric in the past, particularly after Facebook made changes to the way reach is defined.
A general disclaimer: For organic Facebook Page Reach, I do not recommend over-emphasizing this metric. It can be a vanity metric that is not connected to actual results.
However, you may have a reason for more holistic performance reporting, such as when you have a particularly high performing advertised post or campaign, and you wish to include organic results in broader performance analysis.
How to Get Facebook Page Reach Data
The simplest way to access page-level Facebook metrics is to click the Insights tab at the top of your page. Note: if your page is in Business Manager, you’ll need to log into Business Manager first to view this option.
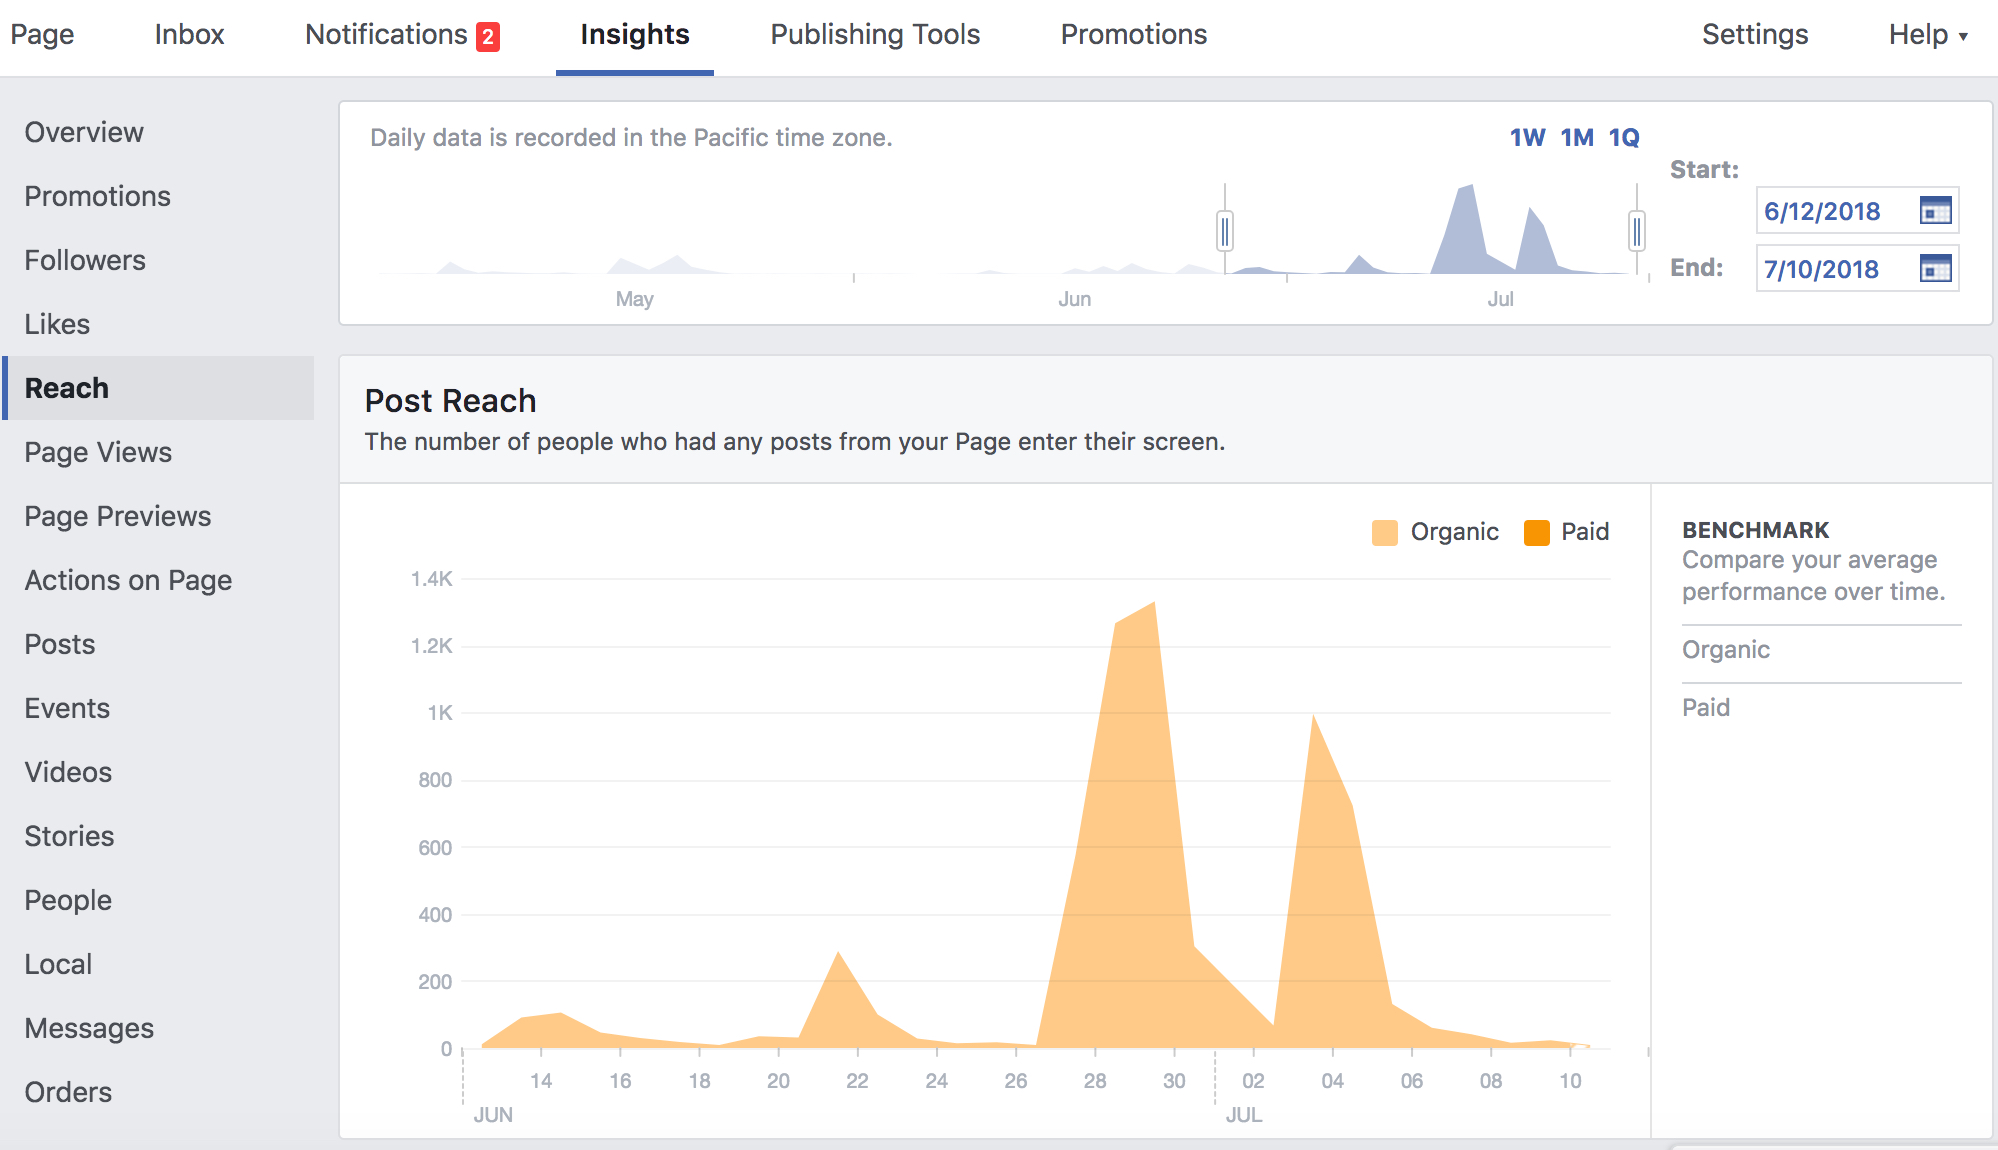
After you click the Insights tab, you can click Reach on the far left. At the top right, you can adjust the date range. As you’ll no doubt notice, this is very high-level information. The options on the top right of the chart can split the data into Organic or Paid.
If you are a bit more daring with your data and want freedom to manipulate it more (don’t be afraid to jump in!), you can export Page Level insights info directly from the page.
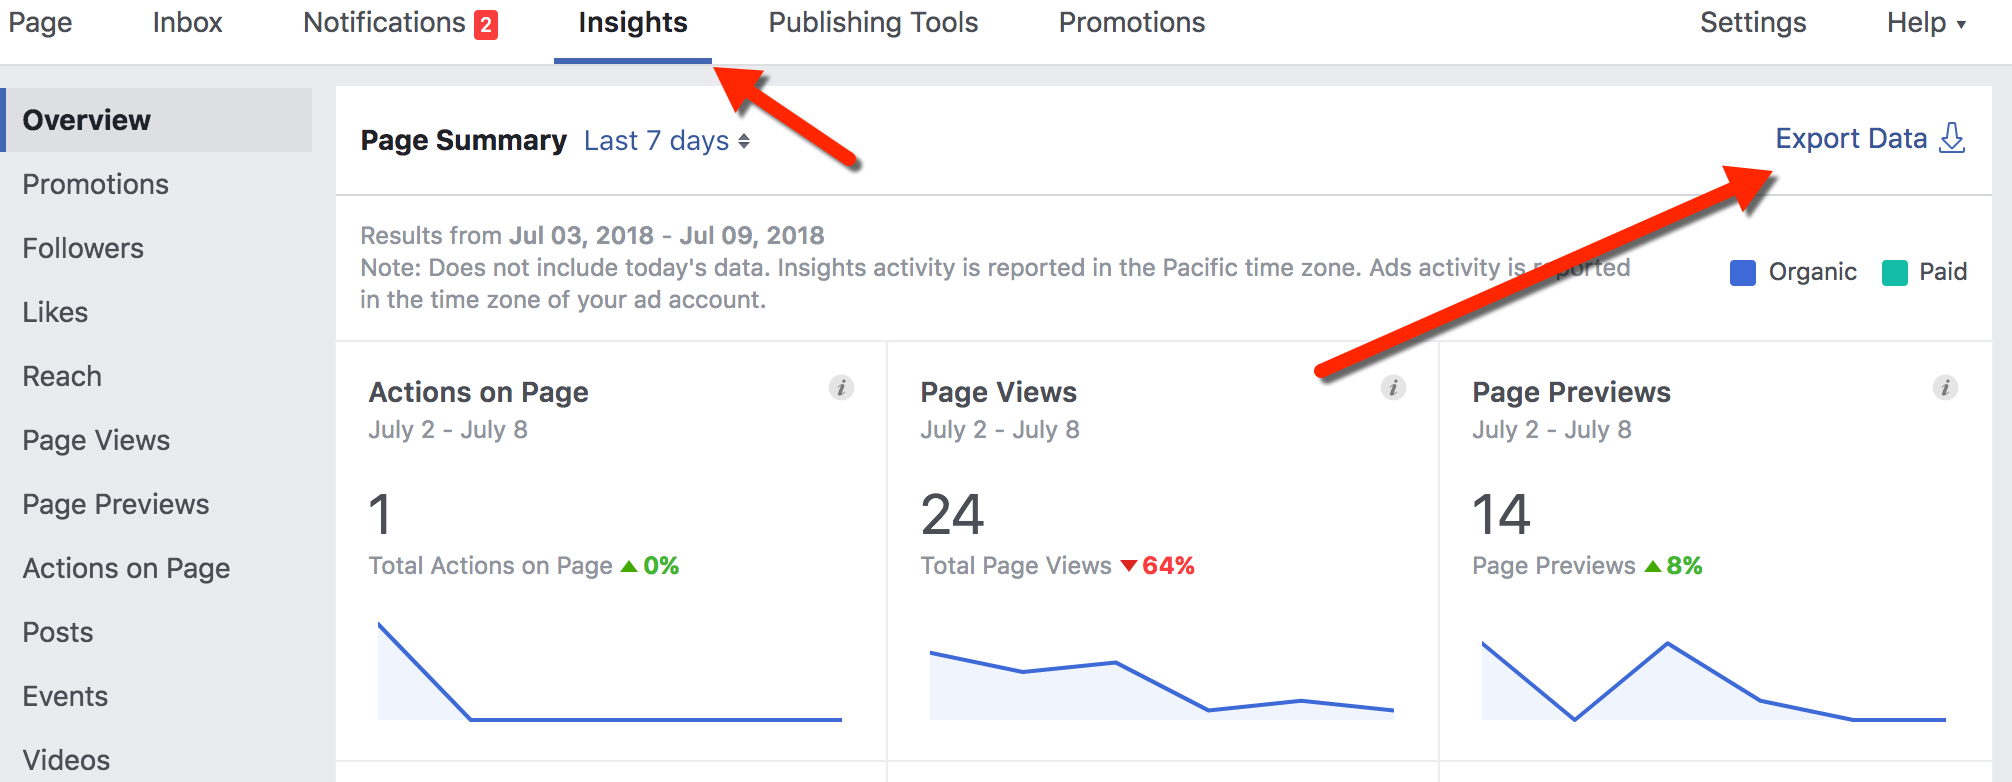
You can export by clicking the Insights tab, then clicking “Export Data” from the top right.
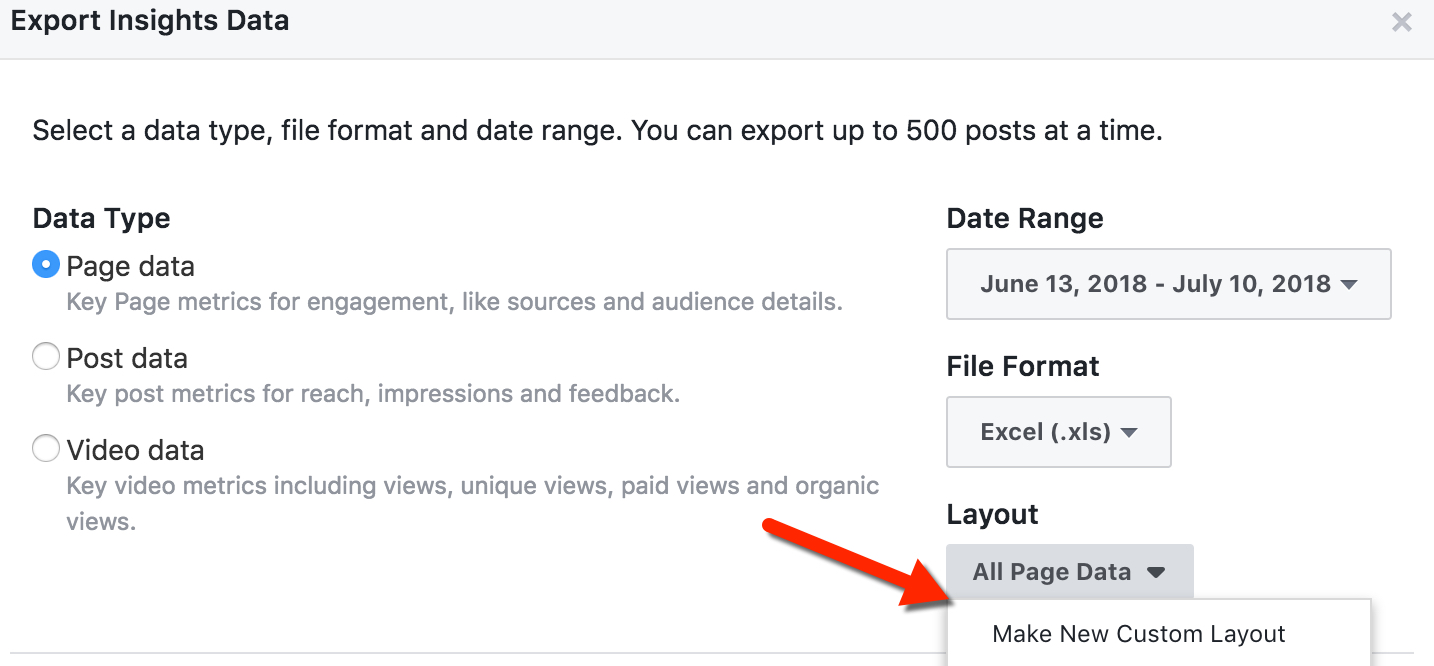
You’ll see options to export Page Level data from this dashboard by clicking the Page data option. You can adjust the time range, and specify the data to be exported.
Facebook offers several options here to change the layout of the data you export. I normally like to download all the data in bulk, instead of running into a situation where I wished I had captured something and have to re-export.
If you want to make a change to your selection, you can do so from here. You can also save a favorite layout so that you don’t have to rebuild it in the future.
Once you have selected the data points you need, click Export, and it should generate a .xls file for downloading.
If you’ve left All Page Data in the export, the first thing you’ll notice is just how much information is captured. There are many tabs offering deeper, fragmented detail. For now, we’ll just focus on the Reach Metrics.
Getting Facebook Page Reach Information out of Page-Level Data
At the time of this writing, on the main tab, you should see the following columns related to Reach: Daily Total Reach, Weekly Total Reach, 28 Days Total Reach.
These are also broken out into Organic and Paid for each time range, as well as something Facebook refers to as “Viral Reach” – which essentially means that a Facebook user saw the post along with some form of social context. That is, they saw the post along with a message saying their friend has interacted with it.
A helpful tip in case you get confused: There is a definition under the header of every column of the export to tell you what it means.
Now comes the fun part!!! (Also where most people tend to make a few mistakes.)
The golden rule on this: you cannot add together lines to get a total number of reach. Said another way – you cannot simply add together reach numbers, line by line, for a total.
This is because each data row is a measure of unique people for that date, and you may have people reached on multiple days who could be counted twice if you simply sum the rows.
For example – let’s say you wanted to know the total number of people who were reached by your page from July 1 – July 5. It seems logical that you could simply add together the numbers from the rows associated with those days. However, Reach is a measure of Unique Users, which is a very important distinction. When you add these numbers together, they are not de-duplicated… so your sum would be incorrect.
We can illustrate this with a hypothetical example…
Let’s say we had the following results, for three different days in July:
- 100 People on July 1
- 200 People on July 2
- 100 People on July 3
If you simply added these together, you would assume you have reached a total of 400 FB users over these three days. However, you (almost) always will have some level of user overlap of reach from day to day. Therefore simply adding these numbers together will give you an inaccurate count.
It’s important to note that de-duplicating is primarily an issue with metrics associated with unique people (such as reach, Daily Page Engaged Users, or any “user” metrics). If you are reporting on a metric that is not unique per user – such as Impressions – you can add across rows without any of these issues associated with duplications in your data.
De-Duplicating Facebook Page Reach Results
While page-level reach reporting is somewhat limited based on how we can de-duplicate user-specific data, there are some ways that Facebook’s system does this for you automatically. An example is the inclusion of the Weekly and 28 Day numbers.
Based on the way these numbers are presented, they should be providing rolling counts of select metrics against the time frame indicated. What this means: for a Weekly Total Reach count, the number indicates the user reach Facebook estimates for your page on a weekly basis, for the dates associated with that specific row.
If you’re more on the nerdy side (or just curious!), you can do your own de-duplication exercise by adding the daily data for a 7-day period and comparing that with the Weekly data reported for the same date.
This will give you an idea of just how badly you can overestimate results if you were to simply add the raw numbers together. This also provides a better understanding of the number of people who heard from your page more than once in a specific period.
Here’s an example with some sample data from a page to illustrate. We’ll walk through the numbers to make sure this is clear.
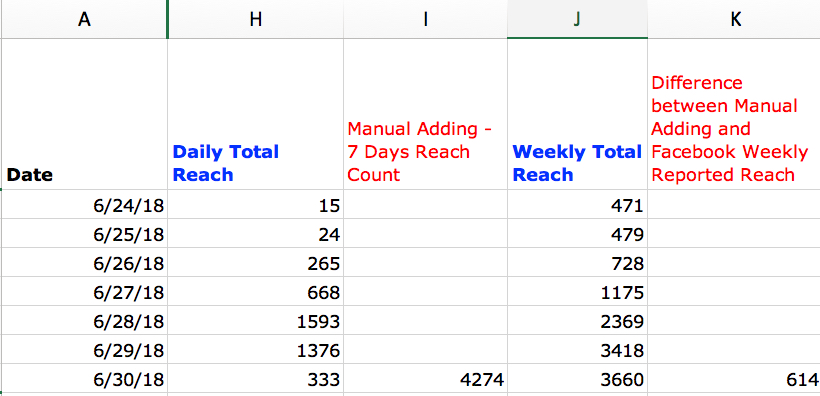
*In this example, the Page-Level export includes columns H and J. I’ve added I and K as calculated columns.
If we use the weekly reported numbers from June 30th as our specific example, we would have simply added the rolling day count from the 7-days prior period had we been doing this manually. This would give us 4,274 total people reached (15 people on June 24th + 24 people on June 25th… etc). However, Facebook reports that the total Weekly Unique Reach was 3660 people. That’s a difference of 614 people.
What does this tell us? For the 7 day period, we had 614 people who were reached at least two times over the period.
While some bit of caution is advised for taking these numbers too deeply to heart (due to the fact that the reach metric is estimated and therefore sampled), this is one method that allows you to get a general idea of your overlap.
Reporting on Impressions
Given the challenges of correctly assessing and interpreting sampled data and manual de-deduplication, it can be easier to stick with the simpler, non-unique metrics such as Impressions.
We can validate that Impressions can be added together with no issues. We can do this by using a similar approach as the above Facebook Reach de-dupe method. This can be seen using this sample page data below:
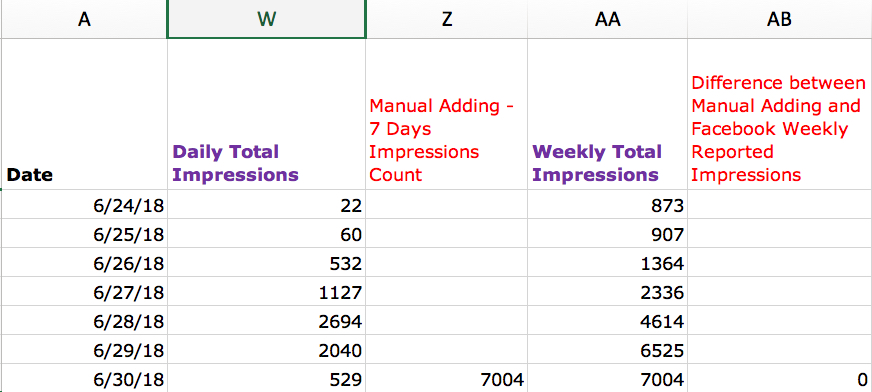
*In this example, the Page-Level export includes columns W and AA. I’ve added Z and AB as calculated columns.
The 28-day metric can use a similar approach.
Reporting on Frequency
You can also combine these data points of Reach and Impressions to get a general idea of Daily, Weekly, and Monthly frequency levels. However, remember that frequency is an average of all impressions. Some people might be reached many times per person, and some are only reached once. You can use this method to report the overall average.
Here’s an example of the method in practice. Remember: Impressions divided by Reach equals Frequency.
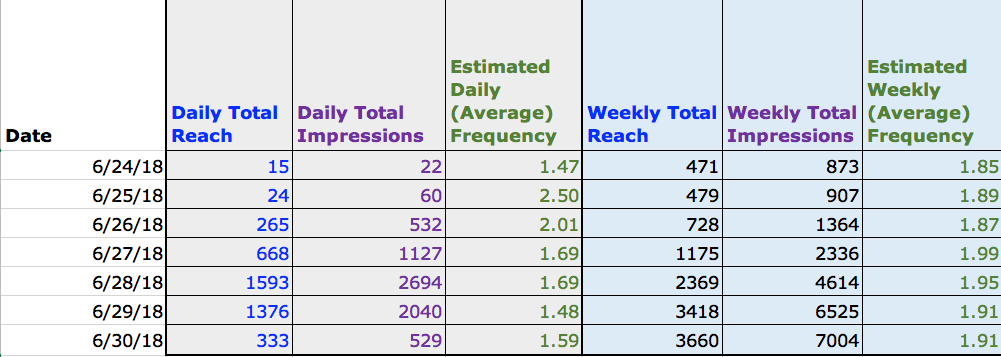
*Estimated Daily Frequency and Estimated Weekly Frequency are columns that I’ve added to the spreadsheet. The Page-Level export included Daily and Weekly Reach and Impressions numbers.
Bonus (nerdy) tip: If you want to get an idea of the frequency distribution (how many people were reached one time, vs. two times, vs. three times, etc) for the Daily, Weekly, or 28 day metrics, you can find those in the additional tabs along the bottom of the page level export. You should find that the cumulative averages of these distributions are equal to the estimated method we used above.
It will look something like this:

These numbers are telling you the overall frequency distribution that your page delivered on a specific date. On June 3, this page reached 109 people 1 time, 13 people 2 times, 2 people 3 times, etc.
Monitoring Frequency
How many times your page content reaches a similar audience can be a good thing to monitor. I normally recommend paying closer attention to frequency at the ad-level (or post-level), instead of page-level.
Bigger problems can arise here when high frequency occurs and users tire of a single ad. By running many different ads (or posts) for a single page, higher levels of frequency may not be as problematic.
If it seems these frequency numbers are higher than you’d like, you could consider doing different targeting (primarily using your paid activity) to evaluate different target audiences for your content. Another option is lowering your budgets for particular ads that have higher frequency.
People often ask about the ideal frequency to mitigate these issues, and there is no simple answer to this. Facebook has published an interesting framework on thinking about frequency, which may be useful for considering your own results.
What Does this All Mean?
- Reporting on your Facebook Page Reach has some challenges. We should fully understand what’s behind the numbers before simply adding a bunch of rows together in a spreadsheet.
- Impressions are a safe metric you can add together with reckless abandon (mostly).
- You can estimate Average Page Frequency. You can also investigate details on frequency distribution in Page-Level exported data.
I’ll write more in the future on Facebook Reach Post-Level reporting, which carries its own strengths and weaknesses.
Your Turn
Do you use Page Reporting? Do you have any particular challenges with comparing performance data from Paid Ads vs your Organic results?
Let me know in the comments below!


