I’ve written previously about reporting on reach using Facebook Insights, both at the Page Level and the Post Level. Now we’ll dive into reporting on Facebook Paid Reach using Facebook Ads Manager.
We’ll address some of the pitfalls in reporting inaccurate data, and how to identify Reach Overlap at the Ad, Ad Set, and Campaign levels.
Remember that reach is a measure of unique users. One of the most common mistakes is to simply add numbers together (for different ads, ad sets, or campaigns), and presume that you have total counts of the people reached.
However, since reach should be a measure of unique people, there are safeguards to ensure that your overall counts are accurate (or at least as accurate as possible for a measure that is estimated).
Luckily for us, Ads Manager has some built-in tools to help us better understand reach. We can use these to avoid common reporting mistakes and identify interesting insights.
Understanding Overlap – Campaigns, Ad Sets, and Ads
One metric that has been available for some time via the Delivery Insights tool is auction overlap. This handy resource is useful for understanding if your ad sets are “competing with themselves” within an ad account.
However, there are other ways to get similar information by using some built-in reporting process from Facebook, along with some simple math. We can also compile information in ways that represent all levels: Campaign, Ad Set, and Ad.
Let’s illustrate this with an example from campaign reporting.
Campaign Reporting
You may be familiar with pulling topline information from your Campaigns tab in Ads Manager.
While Delivery Insights gives some information about audience overlap, it can be somewhat limited. If we are interested in understanding a specific group of campaigns, there is a more powerful method.
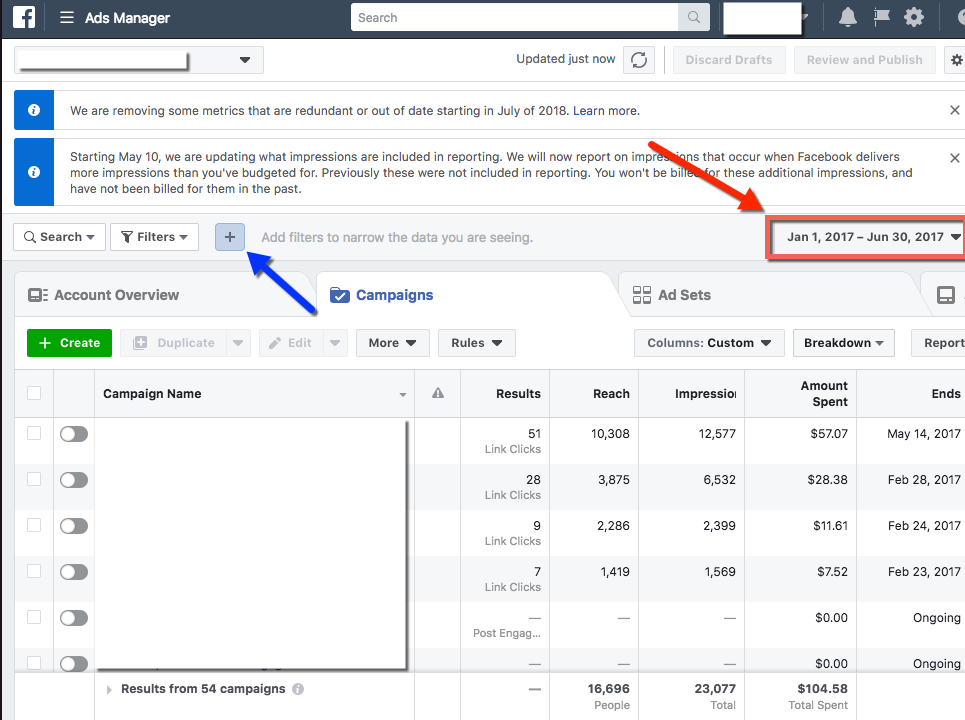
When you initially navigate to the Campaigns tab of Ads Manager, you will see all campaigns listed, for the time range that you select.
Protip: Always be sure to double-check the time range, listed on the top right of Ads Manager. This can default to certain values based on what your recent history. I often make the mistake of forgetting to verify this. Therefore, a good habit is to always select “Lifetime” view to start, and then narrow down the data to your specific date ranges needed.
From this initial Campaign Overview, you should see all of your campaigns that ran during the time range listed. For the purposes of this example, I’ve selected to see specific campaigns for the first 6 months of 2017 in this ad account.
Using Filters for a Cleaner View
You may encounter a situation where you have campaigns listed that did not have spend during the time frame. These should not affect your analysis, but if you want to remove them, you can easily apply a filter.
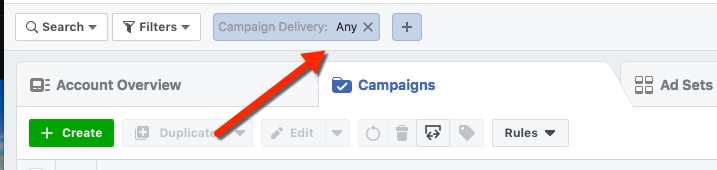
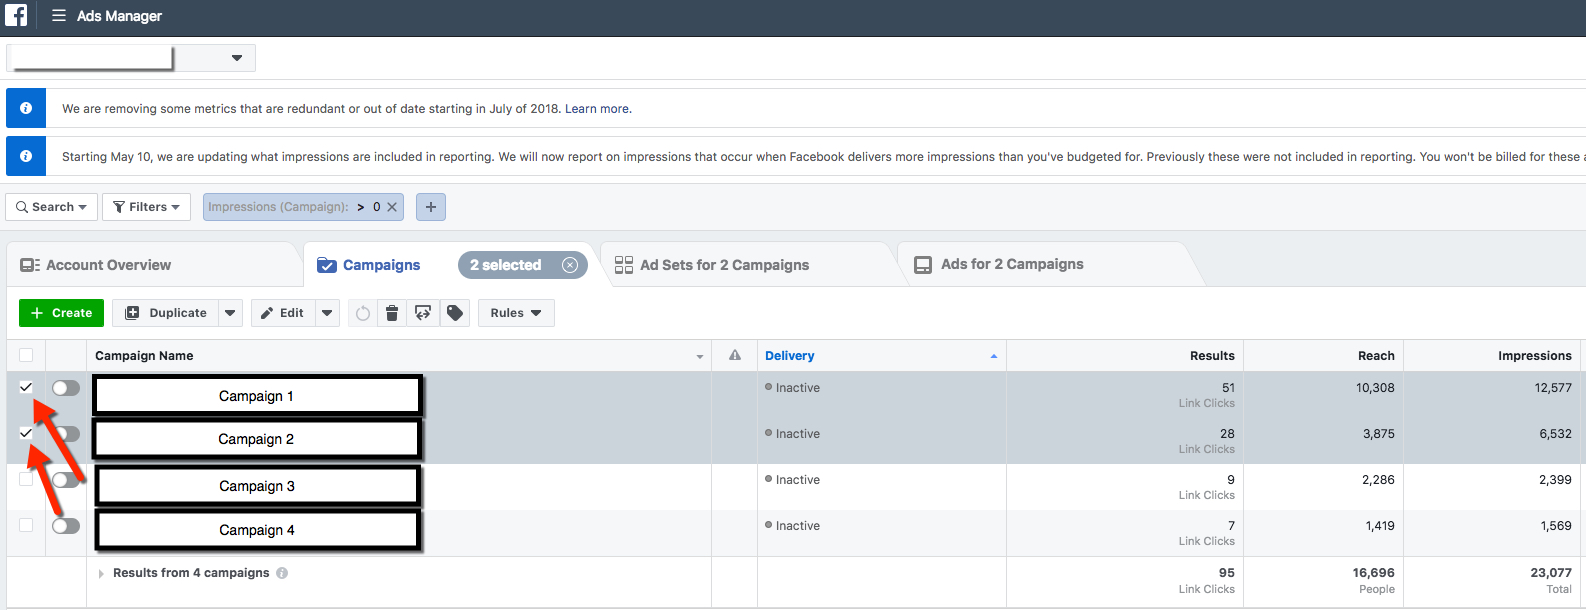
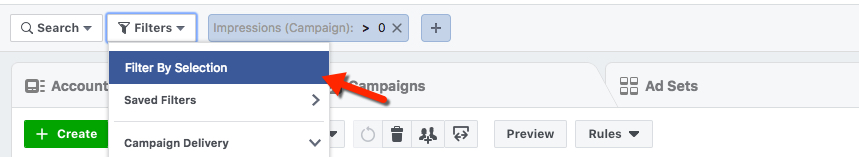
You can apply a filter by clicking the Filters drop down, or by clicking the Plus (+) sign beside the drop down. I’ve called out the Plus sign with a blue arrow in the above image.
My personal preference is to use the Plus sign method, which is most similar to other analytics tools.
I normally use a simple filter. For example, “Impressions ‘is greater than’ 0” populates only those campaigns that delivered impressions during the time range.
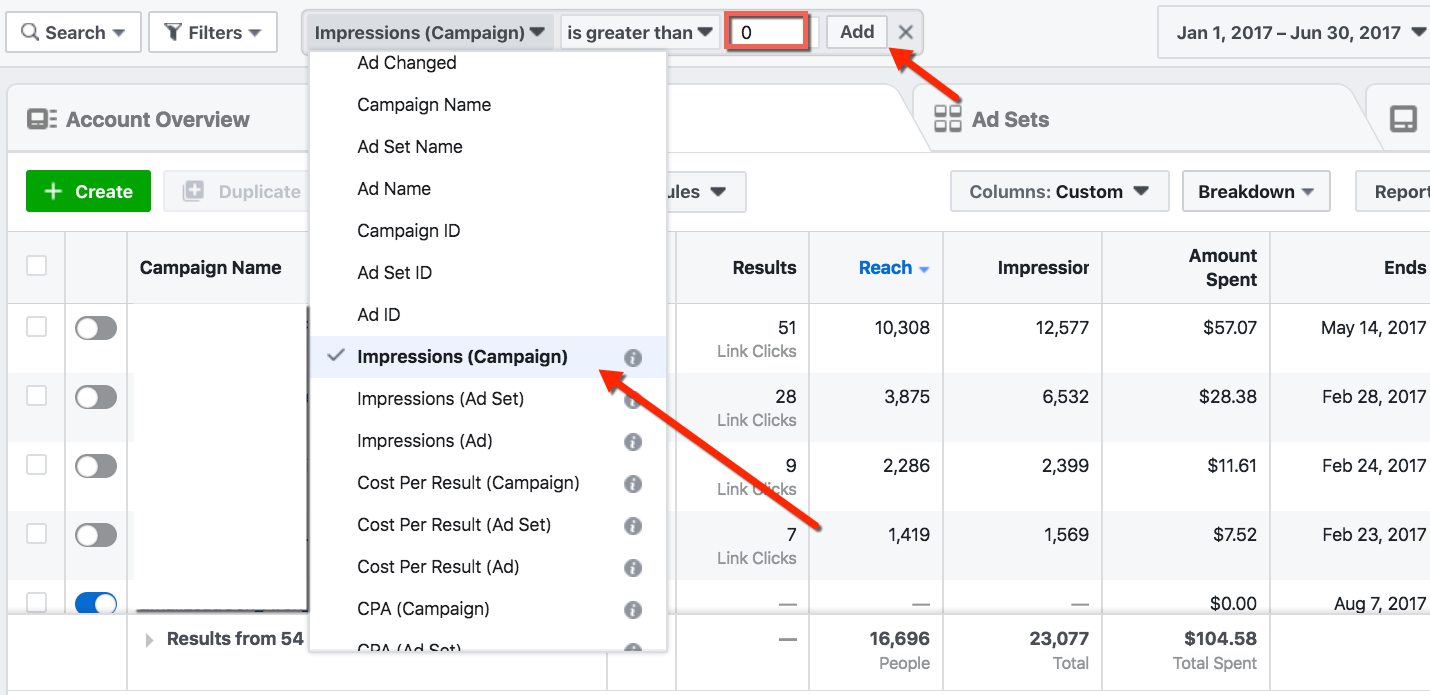
Click Add to apply the filter.
We now see only the filtered results matching our conditions:
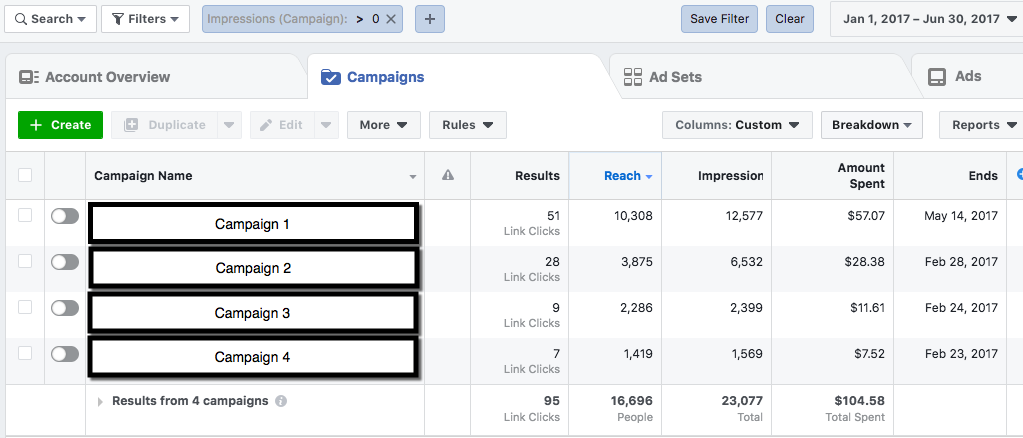
*I’ve given these generic names for purposes of our example.
We can use these data to understand overall metrics among multiple Campaigns that match our parameters.
Overall data is reported along the bottom of the page, where we can see aggregated results from these four campaigns.
Important: Note that these results are showing paid data only, and do not include organic results. General organic, post-level results are available elsewhere. If you’re interested in diving into that topic, check out this article.
Mistakes with Filters and Important Items to Keep In Mind
Using the Filter feature easily warrants an entire article of its own, but here are some helpful reminders for filtering data to ensure you are not missing any results in your reporting.
1. Deleted Campaigns
If you have deleted campaign(s), you may see a message at the bottom that says “Excludes deleted items.” It’s small and easy to miss:
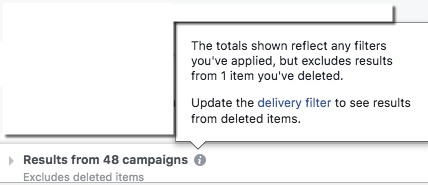
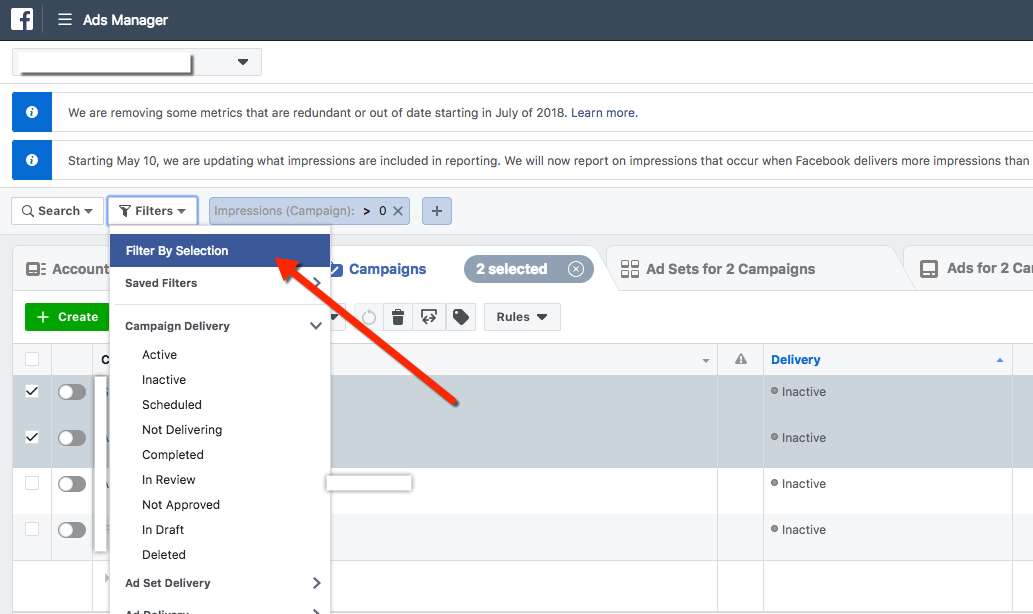
If you wish to capture these results, change the delivery filter as the message indicates. Select the available options from the drop down (Active, Inactive, Scheduled, Deleted… etc).’
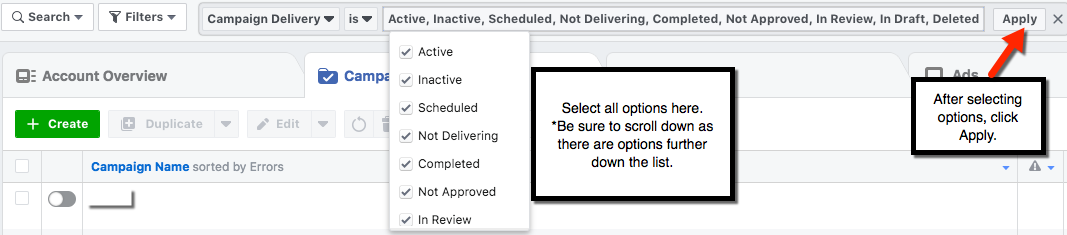
Facebook will update the filter to say “Campaign Delivery: Any” once you select all of the available values and Apply:
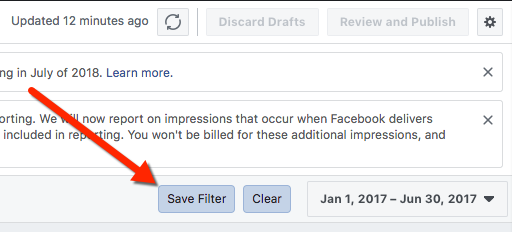
If you want to save this filter, you can click the “Save Filter” button on the far right:
2. Large Volume of Campaigns/Data
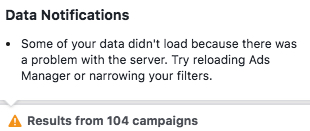
If you have a high number of campaigns, Facebook’s system may sometimes present an error message about trouble loading the overall aggregate information. You can usually address this by applying some filters to decrease data and add specificity. I’ve found that when this error message appears, I can just let the system continue loading, and it eventually resolves without issue:
3. Historical Metrics
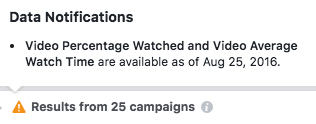
You may also see other notifications called out, depending on the metrics you are viewing. These are usually warnings to keep in mind if you’re trying to compare data over long periods of time, as some metrics are only available as of a certain date. Here’s an example regarding video metrics:
Using Campaign Data to De-Duplicate Facebook Paid Reach
Along the bottom of the reporting view, the summary data will show de-duplicated reach across the campaigns in view. Keep this mind, as we’ll come back to this in a moment.
If we look at the reported Paid Reach for the campaigns in the examples above, we see that we had four campaigns with the following results:
- 10,308 People Reached in Campaign 1
- 3,875 People Reached in Campaign 2
- 2,286 People Reached in Campaign 3
- 1,419 People Reached in Campaign 4
Notice I’ve said “People Reached” instead of just “Reach”. This is a healthy and helpful habit to ensure that I understand which metrics are “People” metrics, as these are the measures of unique users. This is important, as it impacts how we correctly understand overlap using de-duplicated data.
For example, with our sample data from these four campaigns, you may assume that we should simply add these numbers to understand our Total Paid Reach.
This would give us: 10,308 + 3,875 + 2,286 + 1,419 = 17,888 Total People Reached. However, we can look at our summary row at the bottom of this data set and see that Facebook reports our Total Reach as: 16,696 People.
What does this mean? Some people were reached multiple times in these campaigns. In this specific example, we had 1,192 people who were reached at least twice (17,888 – 16,696).
Reporting on Impressions is a simpler process, as this is not a unique user metric. We discussed this previous articles on Post-Level Reach and Page-Level Reach. We can validate this in our sample data. Facebook reported that our Total Impressions were 23,077. This is the same number we would find if we simply added the four rows of impressions together (12,577 + 6,532 + 2,399 + 1,569).
The Power of This Approach
In our example above, we are using data to understand overlap across our entire mix of campaigns. The super cool thing about the summary row? We can use this to compare campaign vs. campaign.
Let’s re-visit our example: We can determine what sort of overlap existed for Campaign 1 and Campaign 2, specifically.
While we could do this by applying various filters, a super quick way to do this is to simply select both campaigns using the check boxes to the left, and then click to “Filter By Selection”. This will show us just the data for those selected Campaigns.
Selecting the Campaigns:
Filtering by Selection:
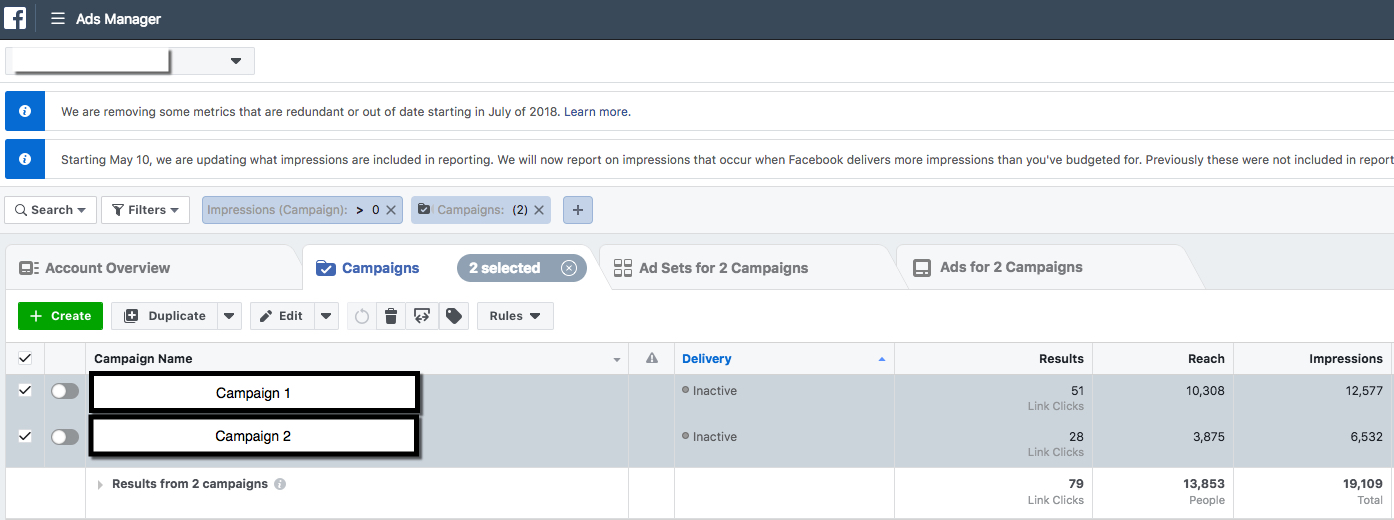
Now we have narrowed our view to only these two campaigns:
Similar to the calculation we used above, we can figure out how many people were reached by both campaigns.
In this example, by adding our numbers together, we would incorrectly assume we reached a total of (10,308 + 3,875) = 14,183 People. However, this is not a reflection of the complete picture.
Since Facebook reports that our de-duplicated Total Reach was 13,853, we can calculate how many people were reached by both campaigns by finding the difference between these numbers.
In our case, we had (14,183 – 13,853) = 330 people reached by BOTH campaigns. How cool!
But wait… there’s more!
We can use this same methodology to understand overlap between specific Ad Sets, and between specific Ads. We can even do this for Ad Sets from separate campaigns, and Ads from separate Ad Sets.
Essentially, we can determine overlap across any component of the Campaign->Ad Set-> Ad structure across all activities within a single ad account.
A final example to illustrate this:
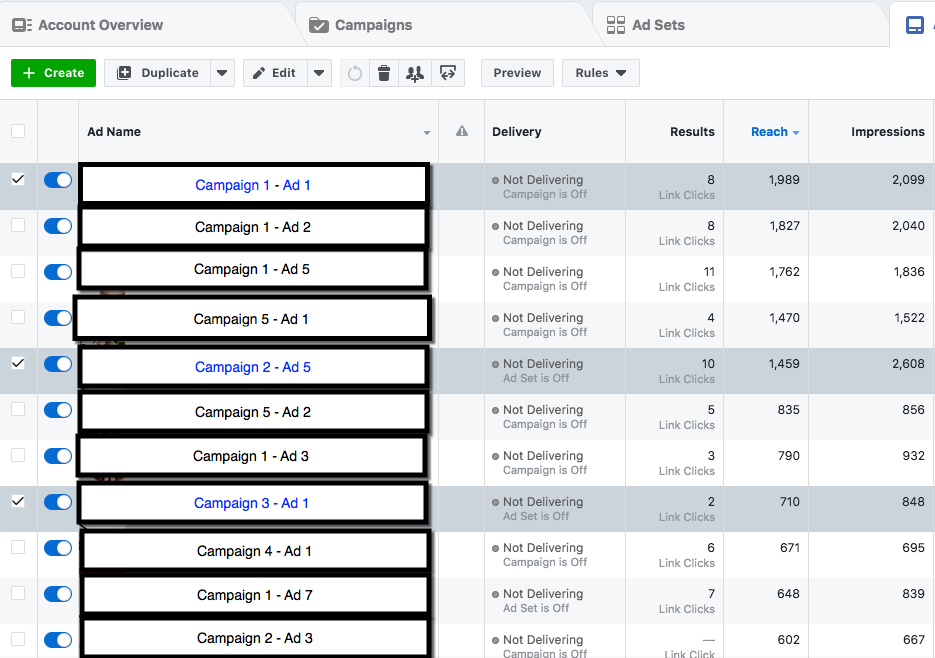
Say you had a random assortment of Ads, sorted by Reach, and you wanted to see determine reach overlap for three specific ads from a large group of ads.
We would first select the ads:
Then we would choose the “Filter by Selection” option:
We now have our filtered view showing only our desired ads:
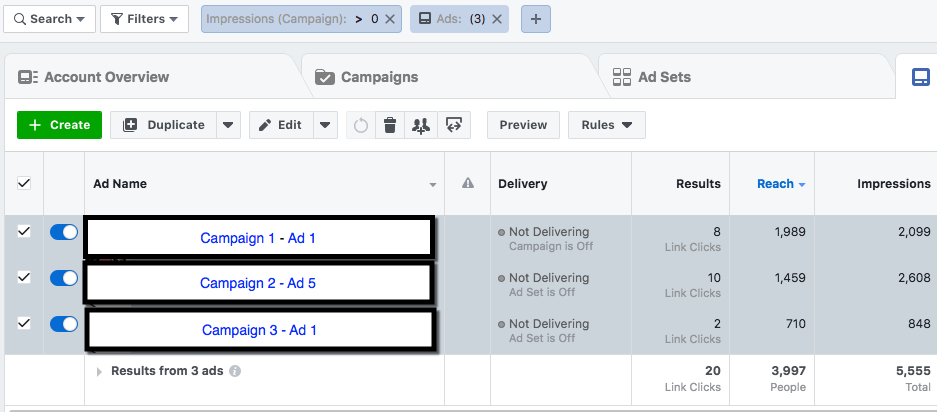
Again using our same calculation methodology, we apply our formula: (1,989 + 1,459 + 710) = 4,158.
Facebook’s de-duplicated Total Reach is 3,997. Therefore we can find that (4,158 – 3,997) = 161 people who were reached at least twice by this group of ads.
The (Facebook Paid Reach Overlap) Formula
We’ve gone through applying the calculations to our data. To boil it down to a single formula, this is what we do:
- Facebook provides us Total Reach from the Summary Row at the bottom of Ads Manager. We’ll call this the Facebook De-Duplicated Reach.
- We identify the specific data rows we would like to compare. We add these together to get a Total Summed Reach.
Using this approach:
- Reach Row 1 + Reach Row 2 = Total Summed Reach
- Total Summed Reach – Facebook De-Duplicated Reach = Reach Overlap.
It’s that simple!
What Did We Learn?
- Applying filters to data in Ads Manager can be a powerful way to segment information.
- Facebook Paid Reach Overlap can be calculated. We do not need to rely only on Delivery Insights for this information.
- We can use a straightforward formula for these calculations across Campaigns, Ad Sets, and Ads. These insights can help us determine if particular ad creatives or targets may be more heavily saturated.
This method can be a powerful tool to understanding ad, ad set, or campaign overlap. Have fun!
Your Turn
How do you use Ads Manager to report reach? What particular challenges do you experience with comparing performance data across Ads, Ad Sets, or Campaigns?
Let me know in the comments below!


