I have long warned Facebook advertisers about the potential pitfalls related to types of optimization and broad audience targeting — particularly when used together. So, what I’m about to describe isn’t necessarily a bombshell revelation. But, it’s a situation advertisers will often find themselves in, and the discovery of misleading results can be alarming.
I’d take that a step further. I have serious concerns about how Facebook builds cold targeting audiences and optimizes for top-of-the-funnel events. If you’re not careful, you will embrace the results and keep on spending.
That, to me, is the problem here. An advertiser who doesn’t know better will see the surface-level results and keep writing checks (or charging their card). And Facebook will happily take that money.
In this post, I’m going to explain what I did. Not only the multiple efforts I made to create cold audiences that would work, but how I adjusted optimization to help eliminate misleading, fluff traffic results. Nothing worked.
But, I’ll also share what’s most important: How I was able to detect that these results weren’t nearly as good as what Facebook was reporting. And how you can follow a similar approach.
Let’s go…
My Goal: Drive Website Traffic to My Blog
My website is a very important piece of my marketing puzzle. I rely on a basic funnel, rather than focusing on converting cold traffic directly to a sale. Free blog content answers questions and verifies expertise, leading to registration for some free thing, leading to one of a number of ways a person might buy from me.
My focus is on lifetime value, not immediate value. You may not buy today. You may not buy a year from now. You may not buy ever. But, I hope to gain your trust so that you’ll eventually be a loyal, paying customer — or recommend me to someone who will be.
While the vast majority of my blog traffic is organic (Google and email newsletter, especially), I want to drive more traffic, if I can. I do drive traffic by targeting warm audiences, but I recently decided to put more budget behind sending cold — but relevant — traffic to my blog.
More traffic leads to more registrations for some free thing which leads to more sales.
My Campaigns
During a period of about two weeks, I would spend close to $1,500 to drive traffic to various blog posts on my website by targeting cold audiences. I used five different approaches, running at separate times.
1. Traffic objective optimizing for Landing Page Views, targeting Lookalike Audiences, experimenting with various Cost Caps.
2. Engagement objective with Website conversion location optimizing for 70% scroll (no Cost Cap) while targeting Lookalike Audiences.
3. Engagement objective with Website conversion location optimizing for 70% scroll (no Cost Cap) while targeting Lookalike Audiences layered with interests.
4. Engagement objective with Website conversion location optimizing for 70% scroll (no Cost Cap) while targeting interests only.
5. Engagement objective with Website conversion location optimizing for 2 page views per session while targeting interests only.
I’ve written before about how I use custom events to optimize for conversions while focusing on quality traffic. That’s what I was doing from campaigns two through five.
The Surface Level Results
Overall, Facebook was reporting some results that could have been acceptable — even good — depending on your perspective.
The CTR for all five campaigns combined was about 3%. The Cost Per Click was $.34. The Cost Per Landing Page View was $.36. It even generated 60-second view events at under $1 each.
Overall, these campaigns drove 3,745 Landing Page Views. According to Google Analytics (using URL parameters), these ads sent about 4,200 people. My goal was to send cold traffic to my blog posts, and Facebook surely did that.
Let’s keep those 3,745 LPV and 4,200 users numbers handy.
Establishing a Baseline for Expectations
Before we dig deeper into the results of these campaigns, it’s important to establish some reasonable expectations. We can’t just blindly determine results are good or bad without some research. We can do that based on some of the other data that I have.
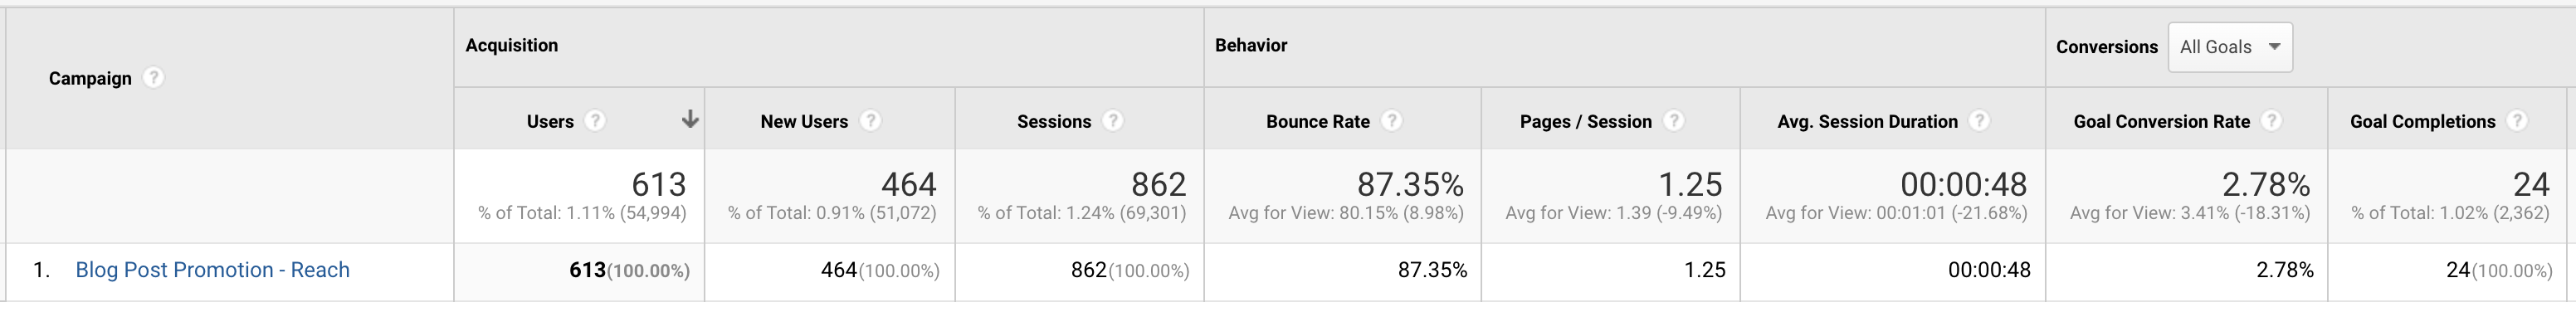
First, I run a Reach campaign targeting warm audiences to promote blog posts — just like the blog posts promoted to cold audiences in the campaigns above. When I add columns for Complete Registrations, Purchases, and Searches, I see that this campaign generated the following actions during January:
- Landing Page Views: 318
- Complete Registrations: 75
- Purchases: 1
- Searches: 61
So, the ratio of conversions (137) to Landing Page View (318) is an admittedly high 43-percent. Keep in mind that Ads Manager will report on view-through conversions and conversions that happened as many as seven days later, and this likely contributed to these results from such a warm audience.
I did use URL parameters for this Reach campaign targeting a warm audience, and those results were a bit more tempered. While I don’t include Searches within my Google Analytics Goals (which will certainly bring this number down), the conversion rate (purchases and registrations) in that case was 2.78%.
The conversion rate for that campaign isn’t far off from the overall conversion rate for all traffic to my website. Google Analytics reports a total conversion rate for all traffic of 3.28% during the month of January.
But, let’s also segment that traffic to set expectations. Google Analytics breaks out New Visitors (most likely to be similar to the traffic from my cold audience campaigns) from Returning Visitors.
- New Traffic Conversion Rate: 2.60%
- Returning Traffic Conversion Rate: 5.24%
Now, what the person clicked on to get to the website matters, too. Any conversion that occurs when someone enters the website to view a blog post is incidental. These numbers also include people who went directly to landing pages.
Let’s recap:
1. Warm Audience Reach Campaign Promoting Blog Posts Conversion Rate of 43-percent. This was really high, and it’s likely impacted by how Facebook reports conversions. That benefit will be far greater for warm audiences that may return to my website during a 7-day period.
2. Google Analytics Conversion Rate of 2.78% for Reach Campaign Promoting Blog Posts to Warm Audience. This feels more in line with what we should expect, though a cold audience will obviously be less effective.
3. Overall Website Conversion Rate of 3.28%. Since some traffic goes directly to a landing page, I’d expect conversion rates from blog posts to be lower. These conversions would be incidental.
4. New Traffic Conversion Rate of 2.60%. Once again, we should expect something lower since that rate includes traffic to landing pages.
So, lower than 2.78% and 2.60%. A reasonable expectation would be something between 1.0% and 2.0%.
Remember the earlier number of Landing Page Views (3,745) reported by Facebook and users (4,200) by Google Analytics? Now, let’s do some math to set a baseline.
- 2.0% Conversion Rate: 75 – 84 Conversions
- 1.5% Conversion Rate: 56 – 63 Conversions
- 1.0% Conversion Rate: 37 – 42 Conversions
Even if we drop all the way down to 0.5%, we can expect 19 – 21 conversions. So, on the lowest end, I’m expecting something around 20 conversions. We’re going to set expectations low so that we can be pleasantly surprised if it’s more.
Conversions Reported in Ads Manager
Earlier, I showed you how Ads Manager reported a pretty insane 43% conversion rate for my Reach Campaign targeting a warm audience. For obvious reasons, I should not have expected numbers this high for a cold audience.
Still, I expected somewhere between .5% (worst case scenario) to 2% conversion rate. I’m hoping for at least 20 conversions.
Instead, this…
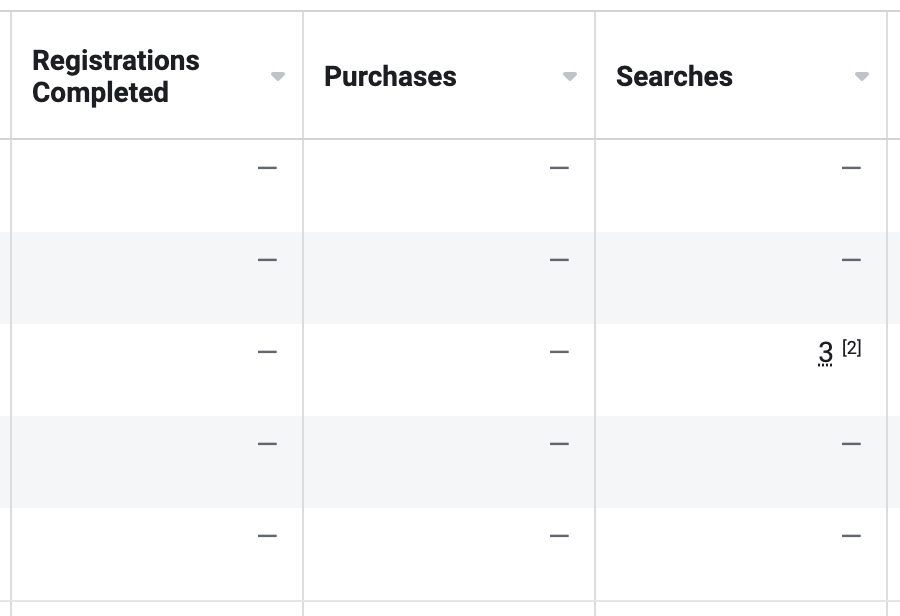
Of the 3,745 Landing Page Views, not a single visit resulted in a free registration or purchase. All I have to show for it is THREE searches (and they all popped into the same campaign at the same time, meaning it was likely a single user).
Well, this is not 20. But, it’s possible that Facebook is unable to report some of the conversions, for a number of reasons.
Conversions Reported in Google Analytics
Luckily, I also used URL parameters so that I can check results in Google Analytics for all of these campaigns.
You’ll recall that the campaign promoting blog posts to my warm audience resulted in a 2.79% conversion rate according to Google Analytics. Also considering the 2.60% New Traffic conversion rate, we were reasonably expecting something between a 0.5% (on the very low end) and 2.0% conversion rate with these cold traffic campaigns.
According to Google Analytics, these campaigns resulted in nearly 4,200 users (4,188 to be exact), a bounce rate of 98.21%, and… not a single conversion of any kind.
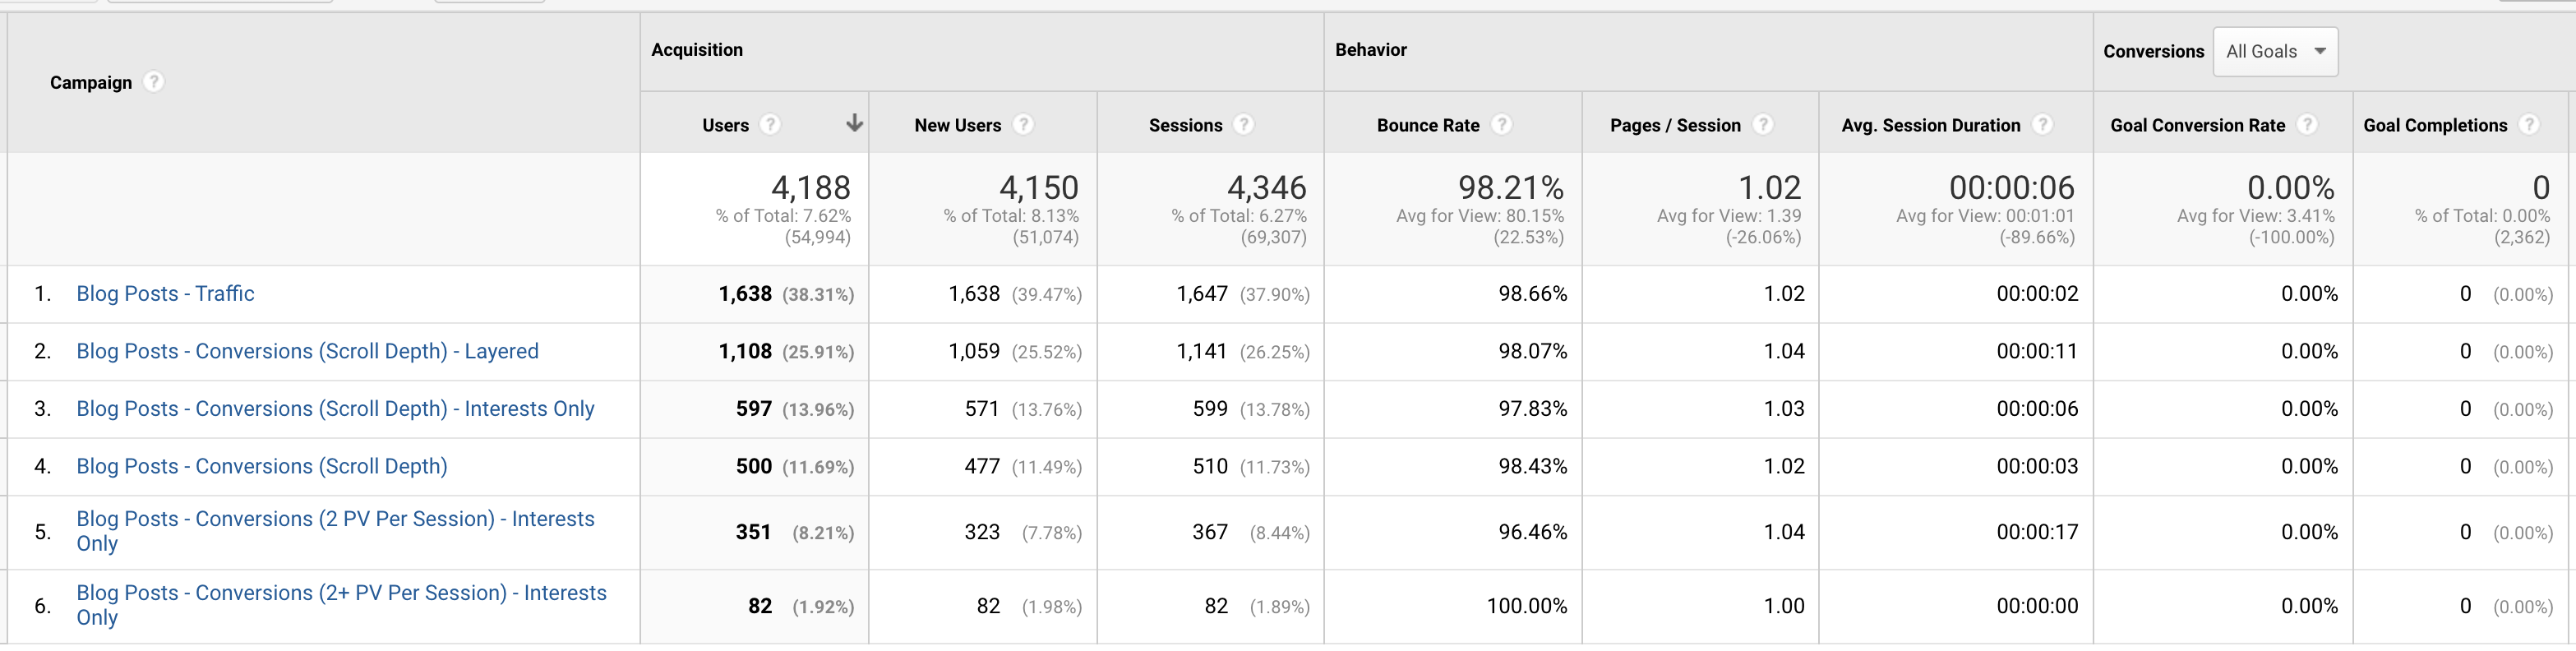
Not a 2.0% conversion rate. Not 1.5%. Not 1.0%. Not 0.5%. Not even 0.1%. No conversions at all.
What is the Problem Here?
The source audiences for my Lookalikes were registrations and purchases. Those source audiences SHOULD be good. Is it how Facebook constructed those audiences? Is it because Facebook now uses Lookalike Expansion?
The interests should also be solid. I made sure to isolate advertisers and digital marketing strategists. Even the Jon Loomer Digital interest. But, could Facebook’s default use of Targeting Expansion be a reason for the conversion campaigns?
Could it be that there were high-quality people in the Lookalikes and interests, but Facebook prefers the low-quality ones? And why would that be? Is it due to the cost to reach those high-quality users just to send traffic?
Could it be the nature of the optimization I used? Even when I optimized for 70% scroll, Facebook found users who would perform the actions I wanted. It’s just that, strangely, none of these people would take an additional step.
It feels so statistically improbable that Facebook could send nearly 4,200 people to my website and not a single one would end up converting. While that may not have been Facebook’s goal (obviously), how is it that Facebook didn’t even luck into sending one of 4,200 people who would decide to convert while they were on my website?.
Is there a reasonable explanation?
I’m not a conspiracy theorist. I tend to favor the most obvious and simplest explanation. But I have a hard time explaining this.
Now What?
Consider this a cautionary tale.
I used every guardrail possible. I created Lookalikes based on very high-quality sources. I did things most advertisers wouldn’t, including optimizing for and tracking high-quality traffic custom events. The typical advertiser may not even spot these issues. They’d just keep spending their money.
It makes it seem virtually impossible to send quality traffic that actually has the potential to convert when optimizing for Landing Page Views or a traffic conversion while targeting a cold, broad audience. This, though, is a problem for a couple of reasons.
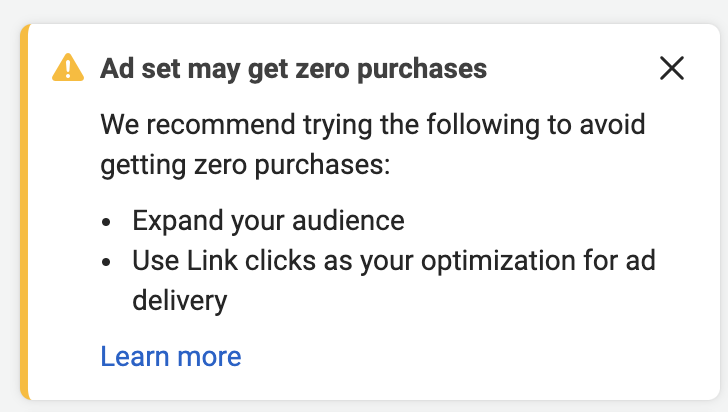
First, Facebook often recommends optimizing for Link Clicks and Landing Page Views if you can’t get the necessary volume to exit the learning phase when you want conversions. It would seem that this would not be a productive approach.
This is also counterproductive related to building your website custom audiences. By sending these 4,200 people to my website, I am watering down the quality of what is otherwise a very effective group of people to target.
This doesn’t mean that optimizing for Landing Page Views and custom events for traffic as I have will never work. It doesn’t mean you shouldn’t ever target broad audiences.
But, you should be careful. You should be aware of how misleading results can be. Look beyond the Landing Page Views, CTR, CPC, and more.
This is a big reason why I continue having a hard time abandoning my warm audiences, despite Facebook’s insistence that its optimization is amazing and you should go broad. That may work for purchases, but you should be ultra vigilant when it comes to traffic or engagement.
Your Turn
What has been your experience with driving traffic to your website while targeting cold audiences?
Let me know in the comments below!


