Meta released their 1Q quarterly earnings for 2023, and it’s mostly positive. But, there’s something that jumps out that needs an explanation: Why are Meta ad prices dropping?
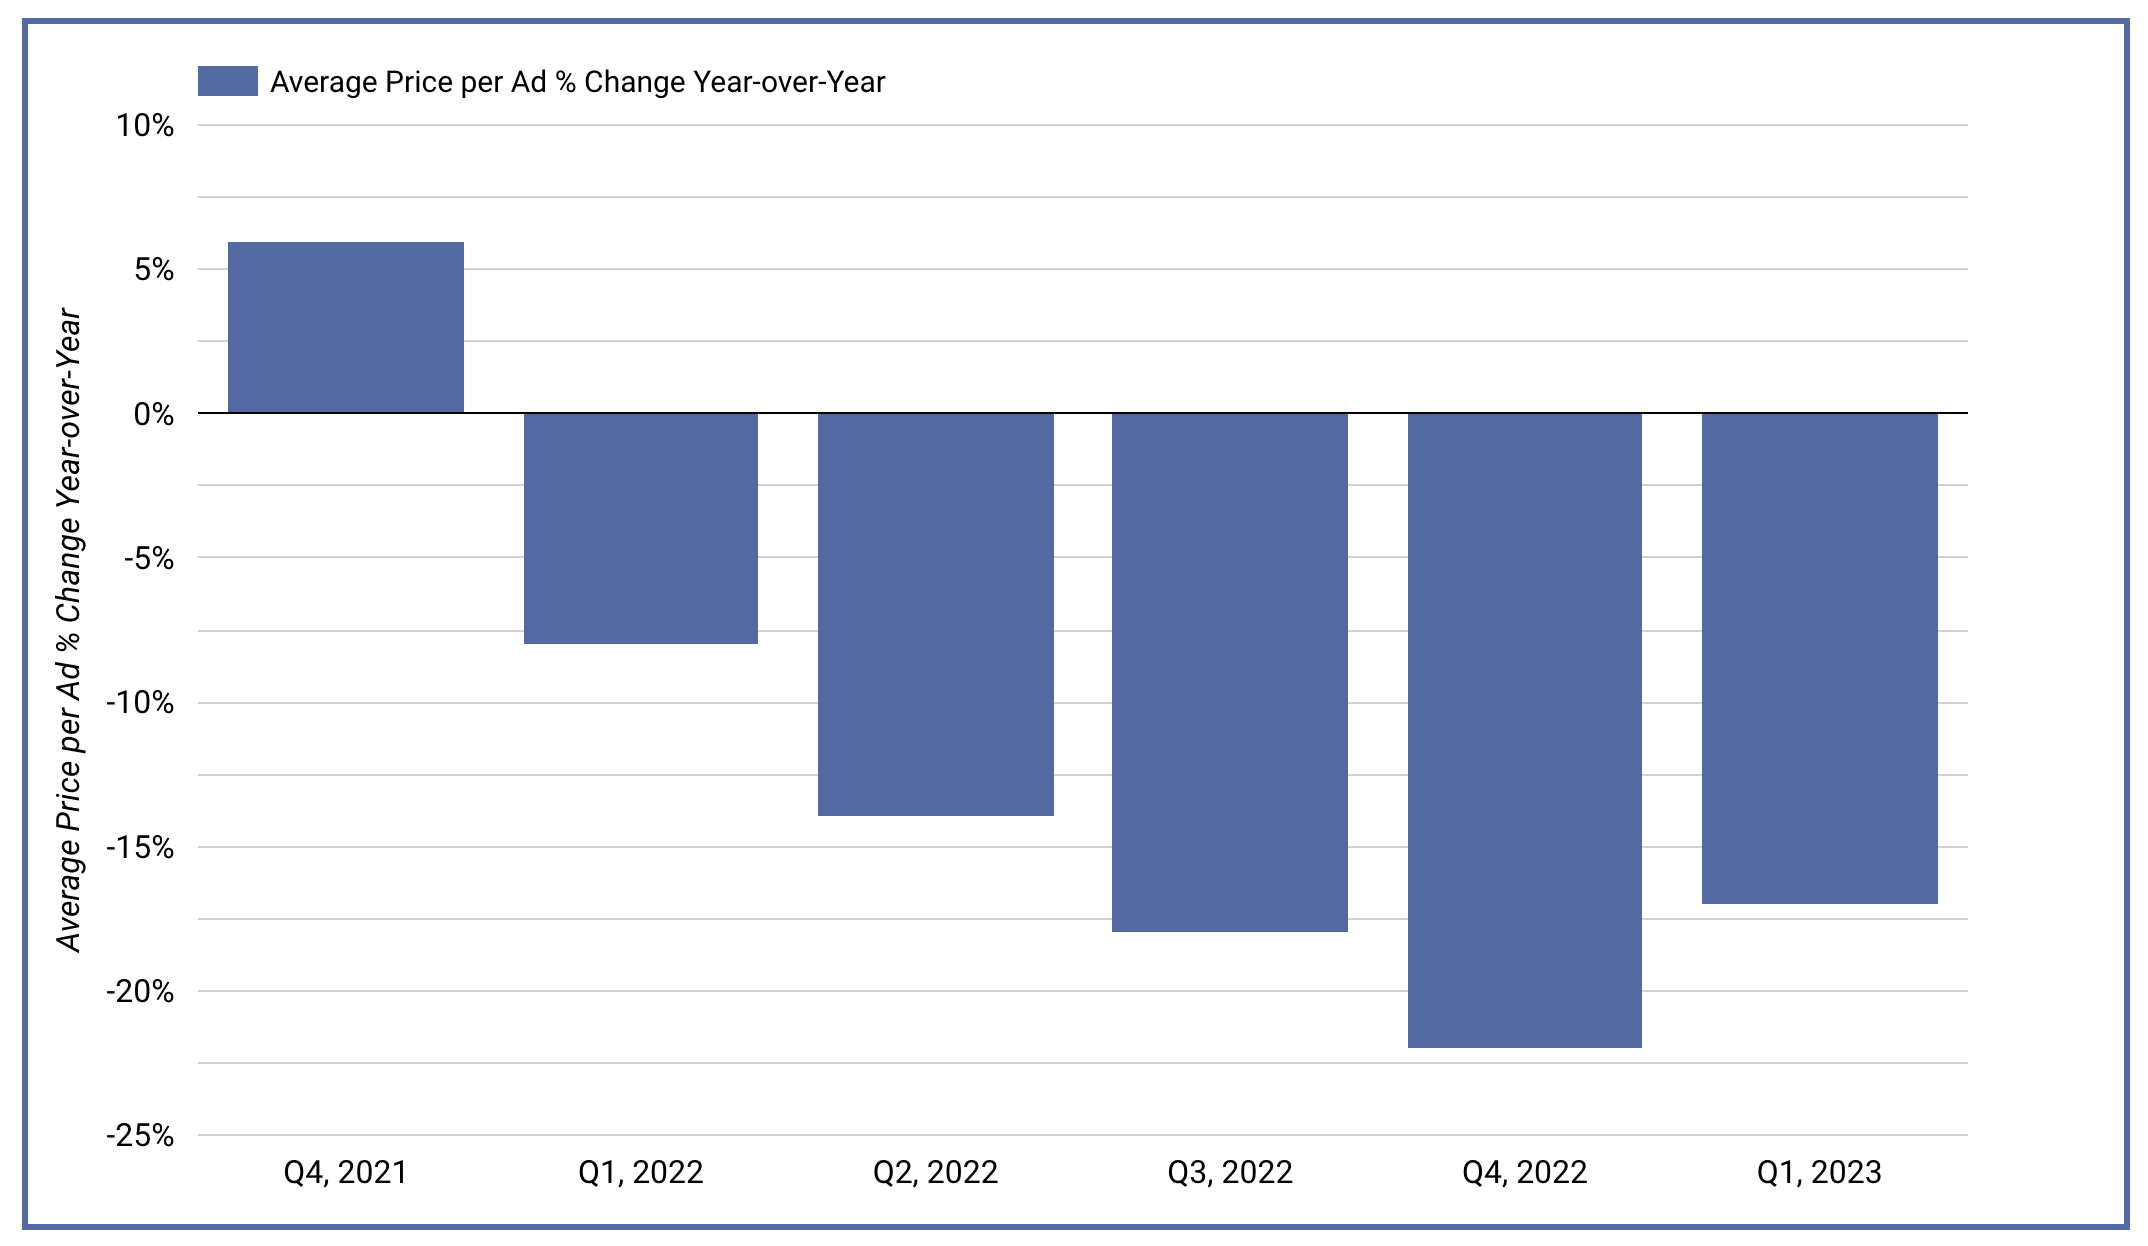
In the chart above, you’ll notice that Meta’s average ad price has dropped year-over-year for five consecutive quarters, dropping 17% in the first quarter of 2023. Why is this happening?
While a drop in ad prices may seem like a positive for advertisers, it’s important to understand why this is a trend. If it’s because the targeted audience is increasingly more saturated by ads, that may not be a good thing long-term. Increasing ad frequency may eventually make them less effective.
Let’s explore…
Our Meta Quarterly Earnings Data Segmenter is the source of many of the graphics in this post. Thanks to Luke Elliott for keeping this helpful tool updated!
Inventory
While the average ad price dropped 17% year-over-year, the number of ad impressions increased 26%.
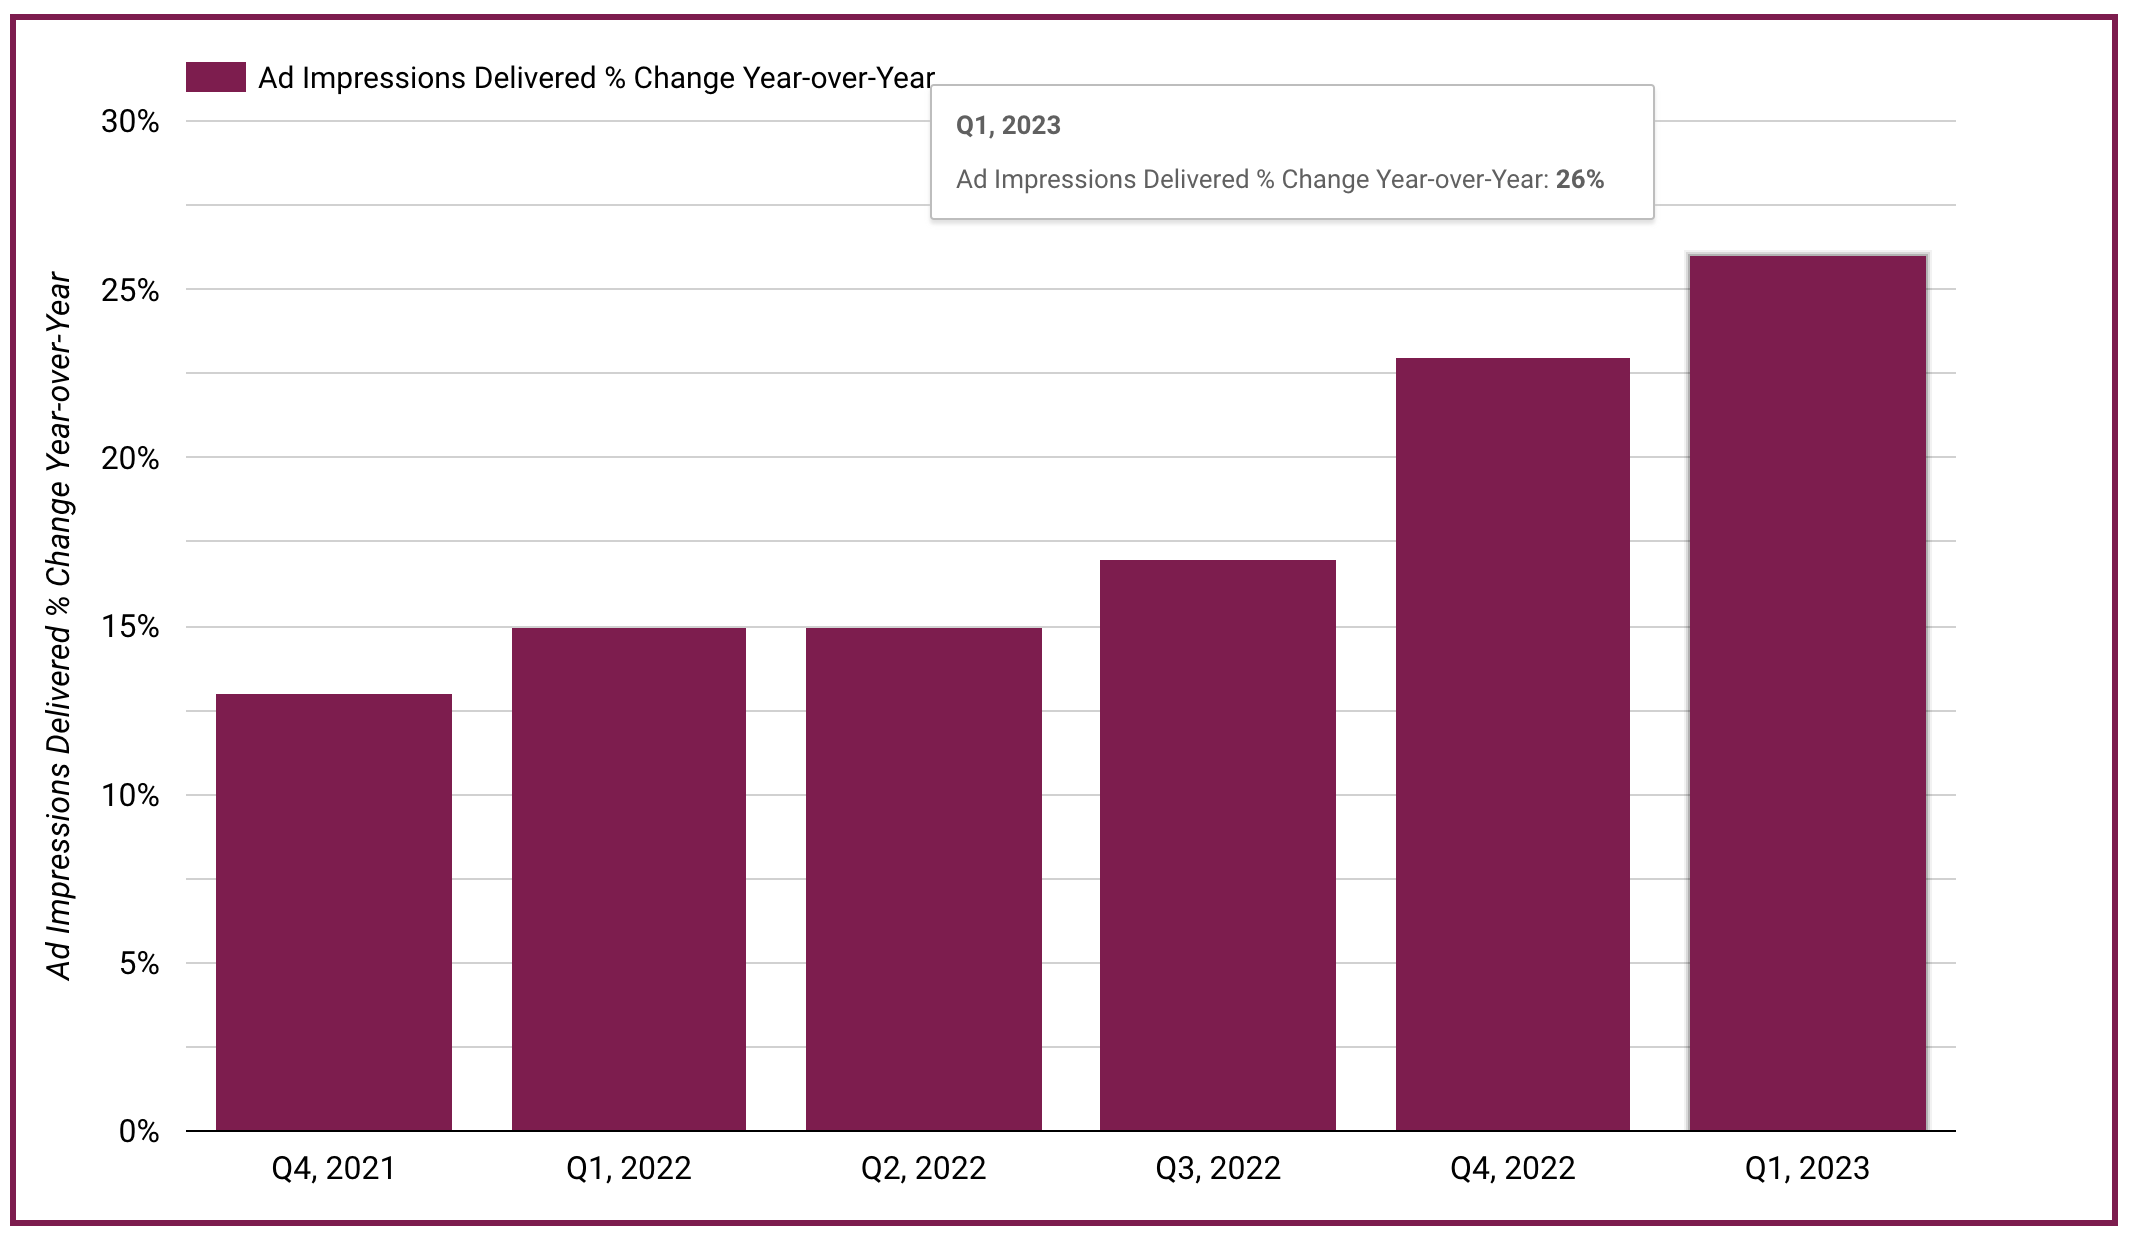
That’s quite the increase.
I’m not a data expert, but I understand that Meta’s ad prices are determined in an auction. A drop in average ad price and increase in ad impressions is likely tied to an increase in inventory. Ads are shown more often, whether it be because there are more users, users spend more time on the platform, or ads are shown in more places.
Let’s explore the potential explanations for these trends…
User Growth
While the number of users on the Meta family of apps did increase, it’s only about 5% year-over-year. Here’s a look at the growth of monthly active users on all Meta apps…
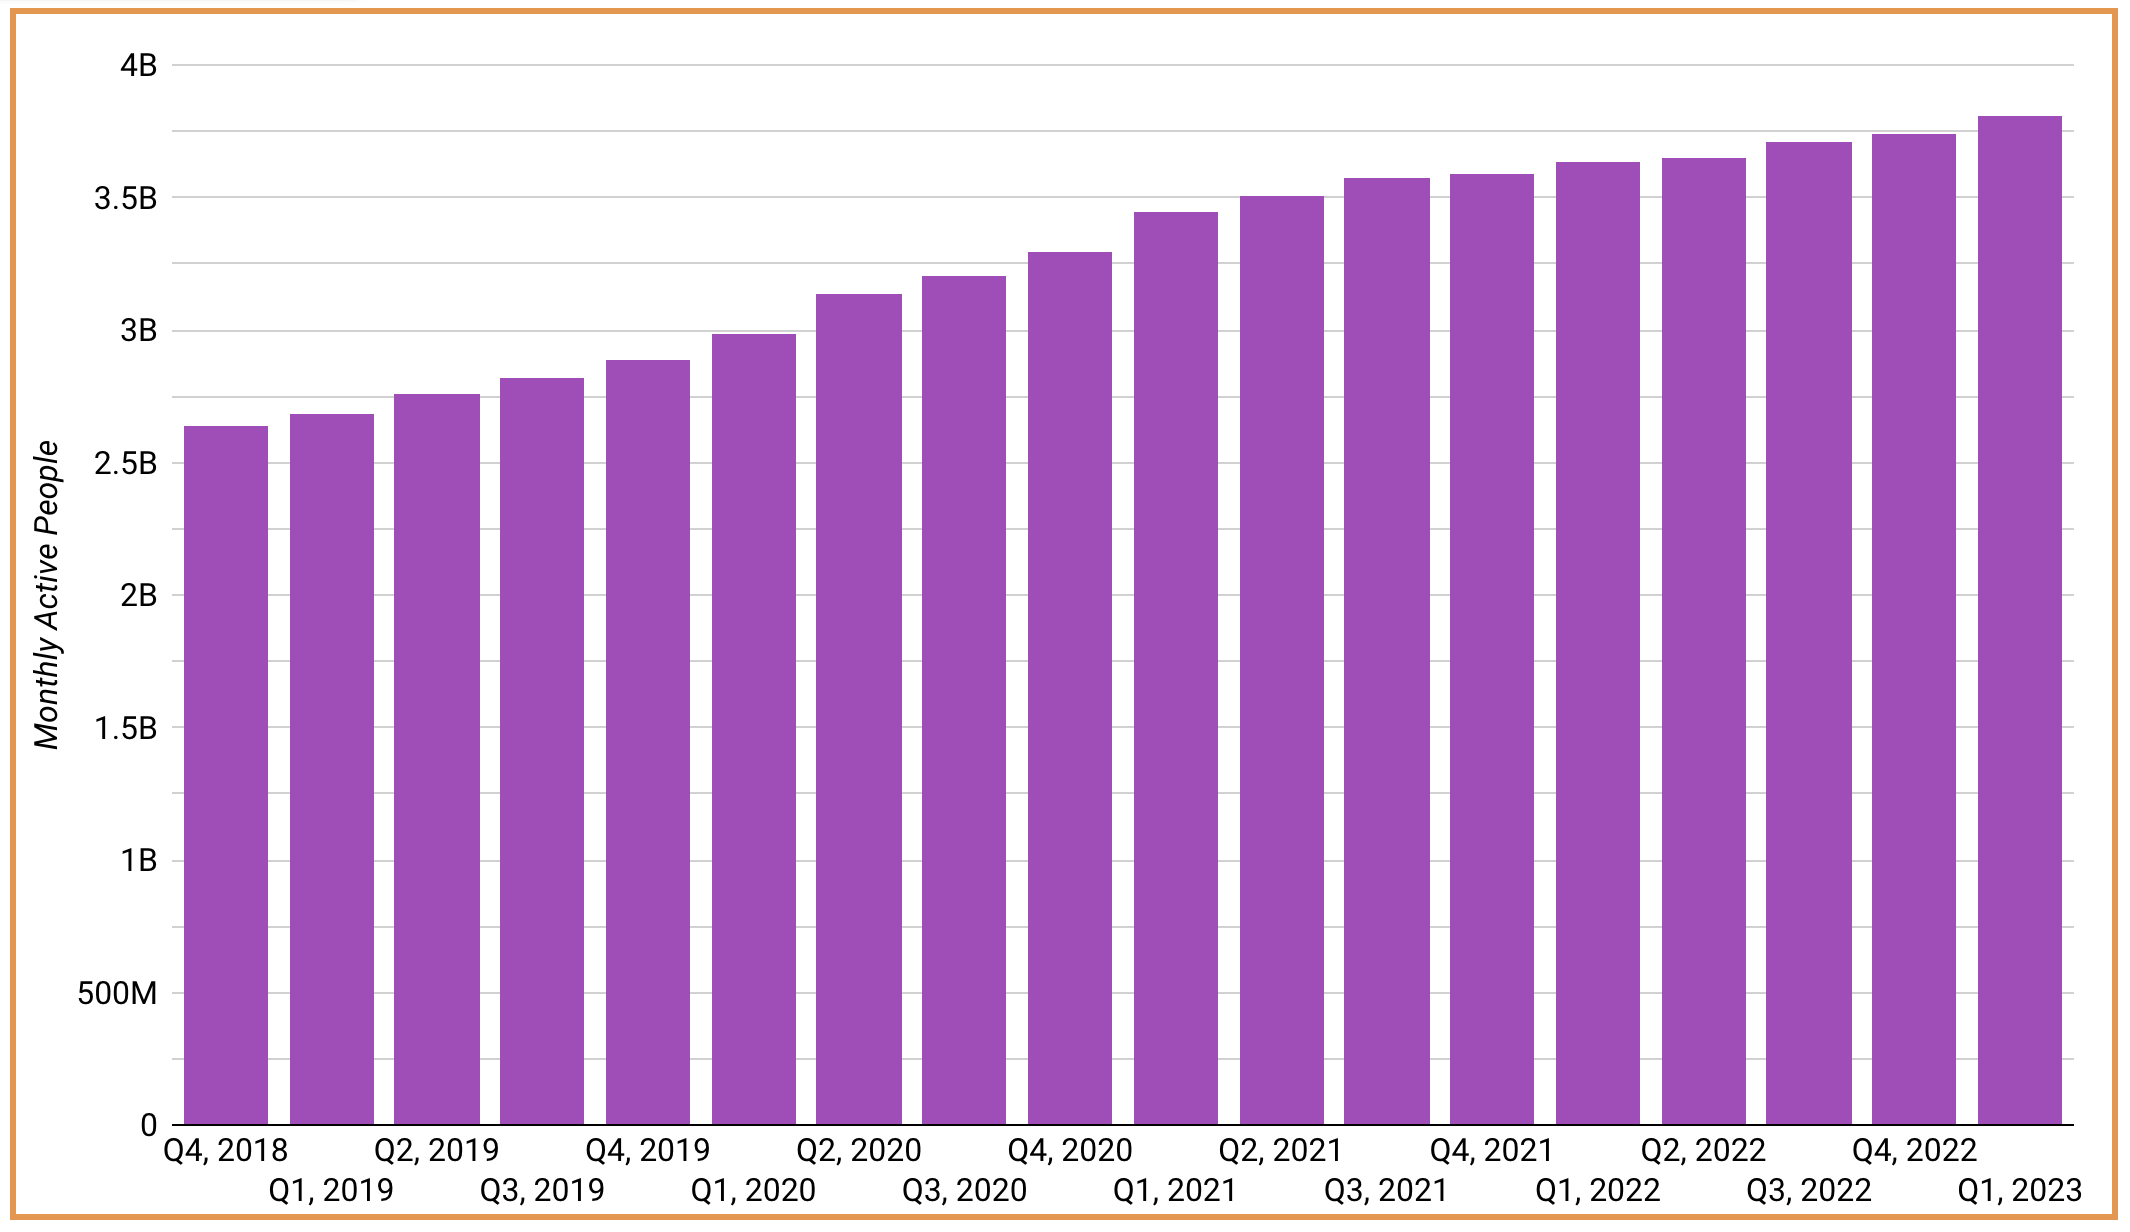
It doesn’t seem possible that this increase alone could explain the drop in ad prices.
User Activity
While one way to increase inventory is to increase the number of users on the platform, another is for users to spend more time there. For example, you may see five ads if you spend five minutes on the app today, but you’ll see 100 if you spend 100 minutes.
Unfortunately, Meta doesn’t provide information related to time spent on the platform these days. But, they do provide something that can be helpful here.
Daily Active Users vs. Monthly Active Users helps us understand the ratio of total monthly users who return on any given day. A 1:30 ratio would indicate that the typical monthly active user only appears for one day, whereas a 1:1 ratio suggests that they return on a daily basis.
Let’s look at the trend of this ratio for just the Facebook app since 2016…
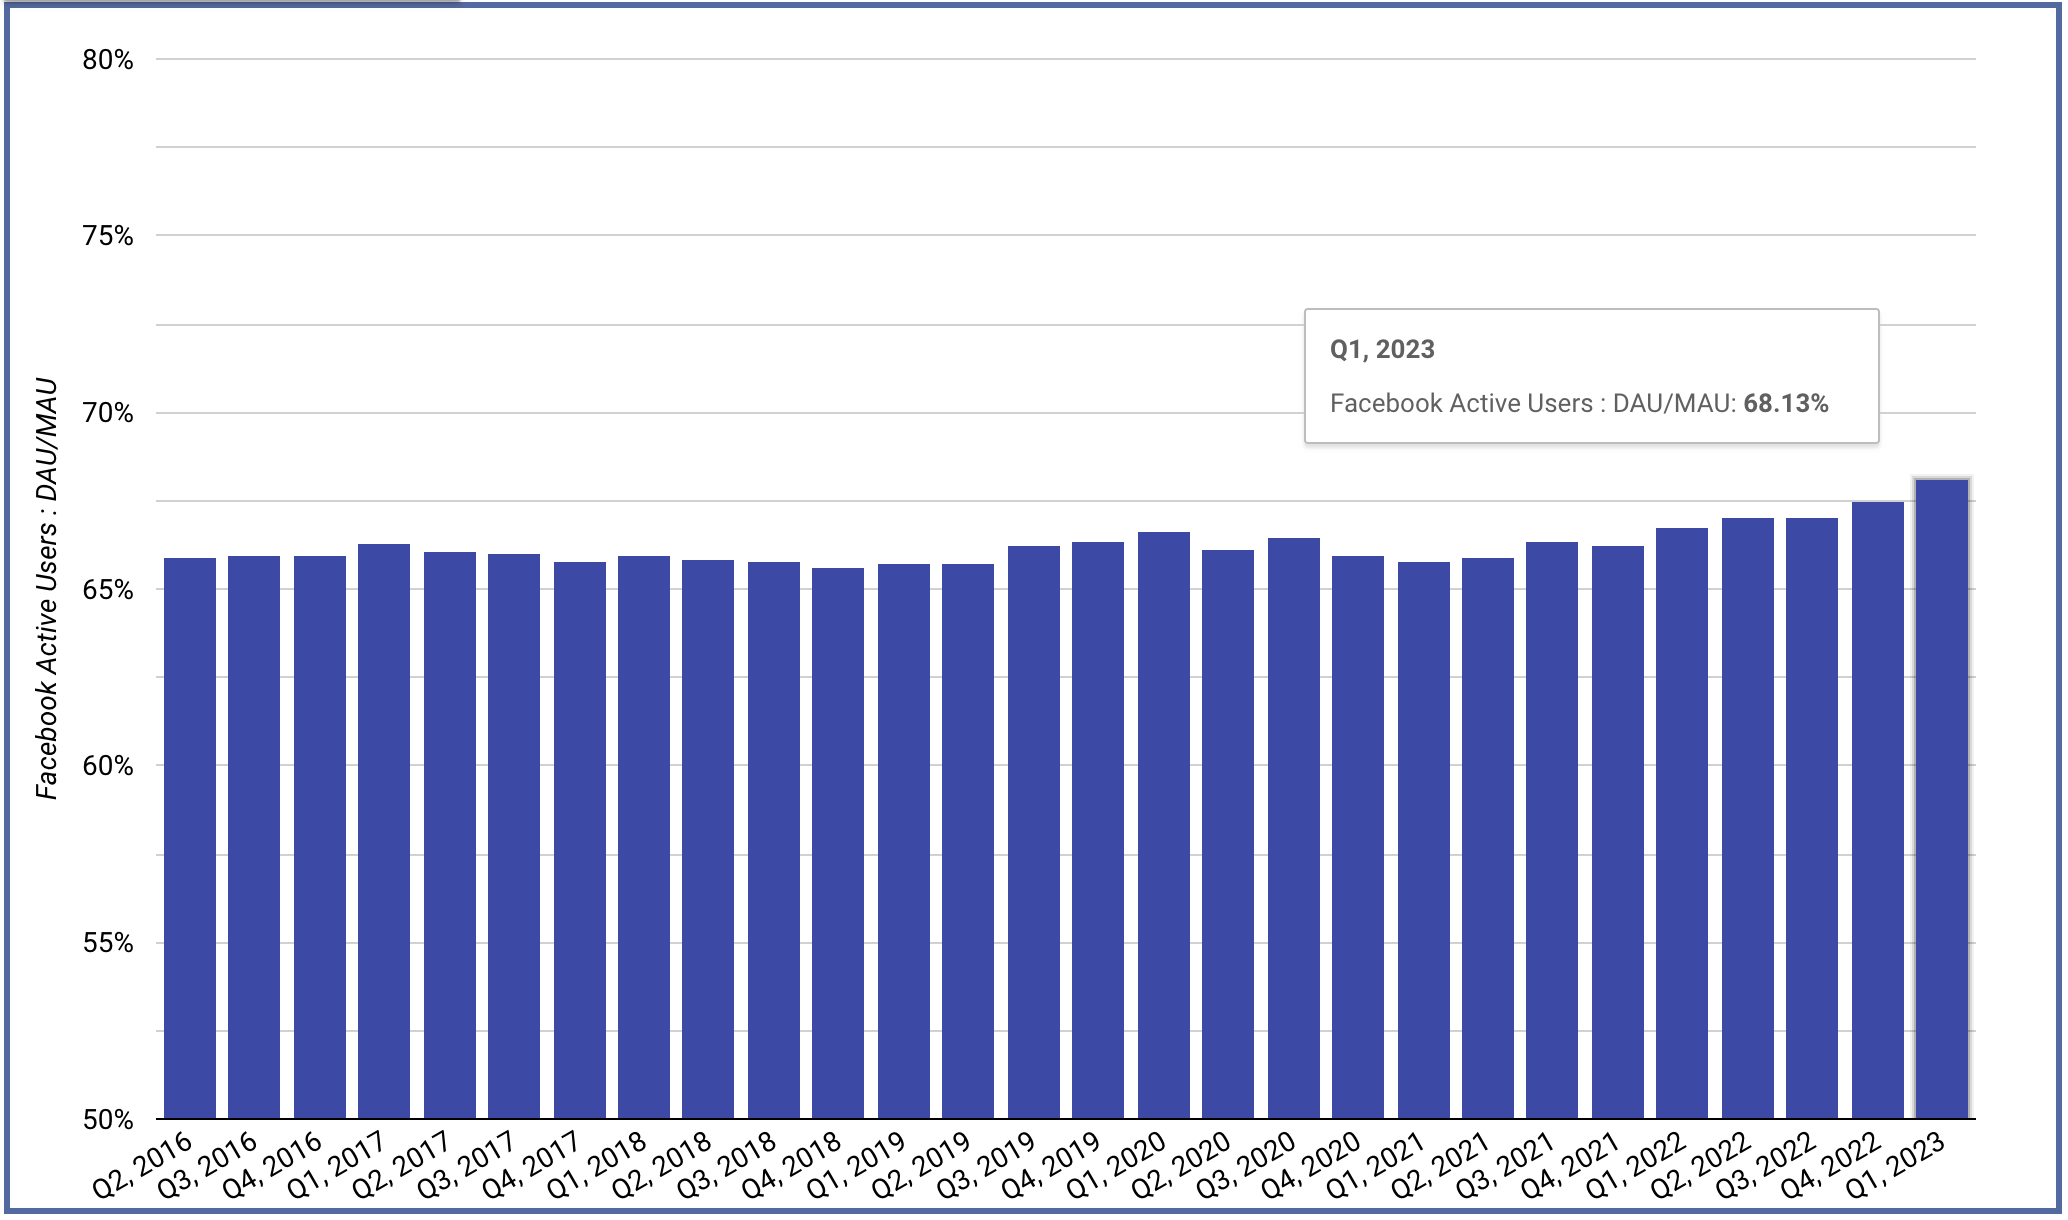
This is actually surprising. I had thought that this percentage hit its peak and would never exceed 67%, but it just hit 68% for the first time. Facebook users have never been as active (at least in terms of returning on a regular basis) as they are now (dating back to 2016).
Let’s dig a little deeper and see where this increase is coming from. While return engagement is extremely high in the US and Canada, it has been dropping…
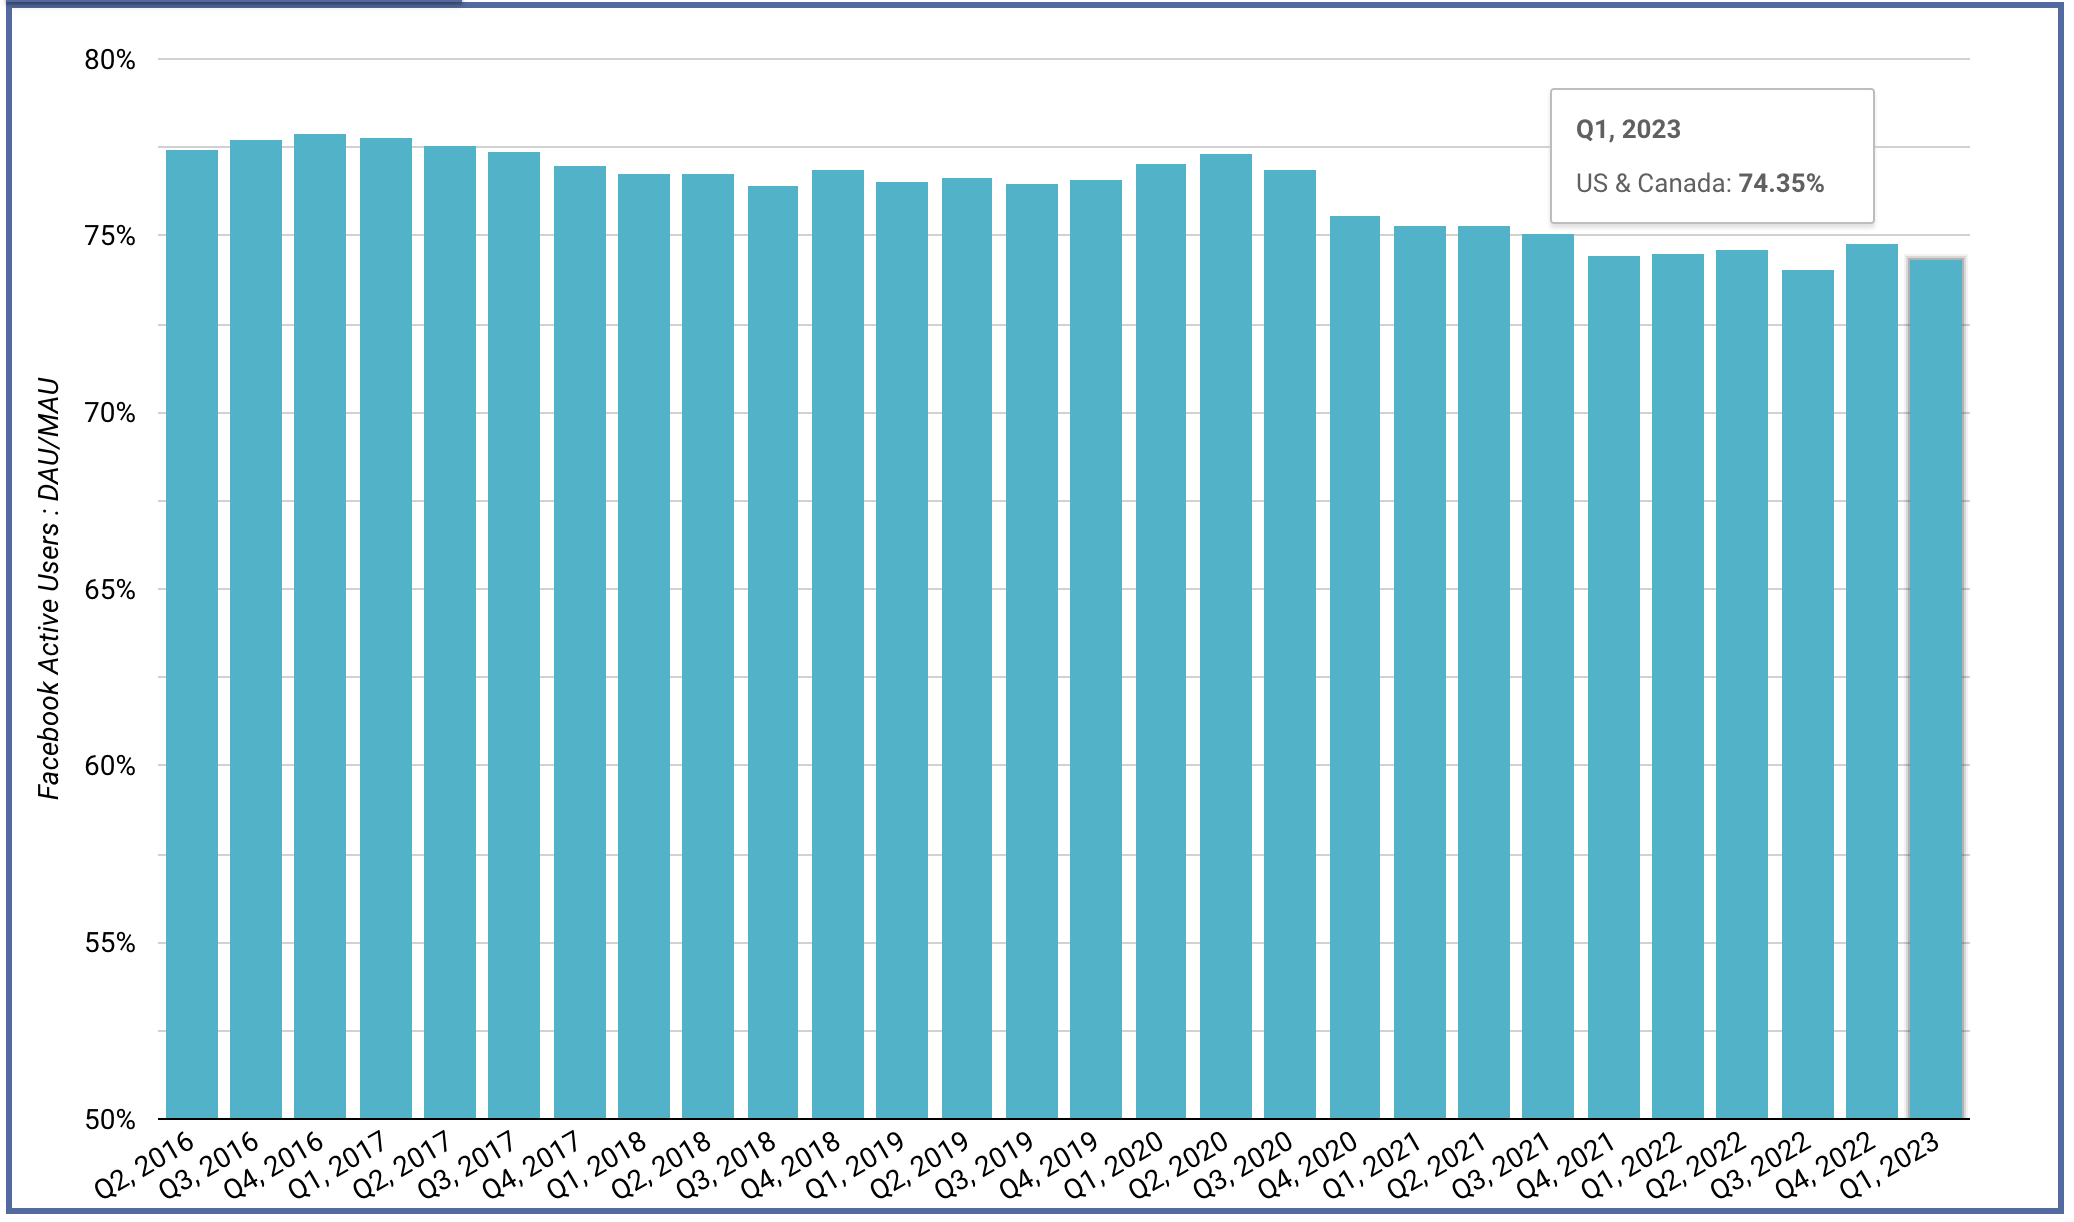
For context, that 74.35% is still higher than the overall average.
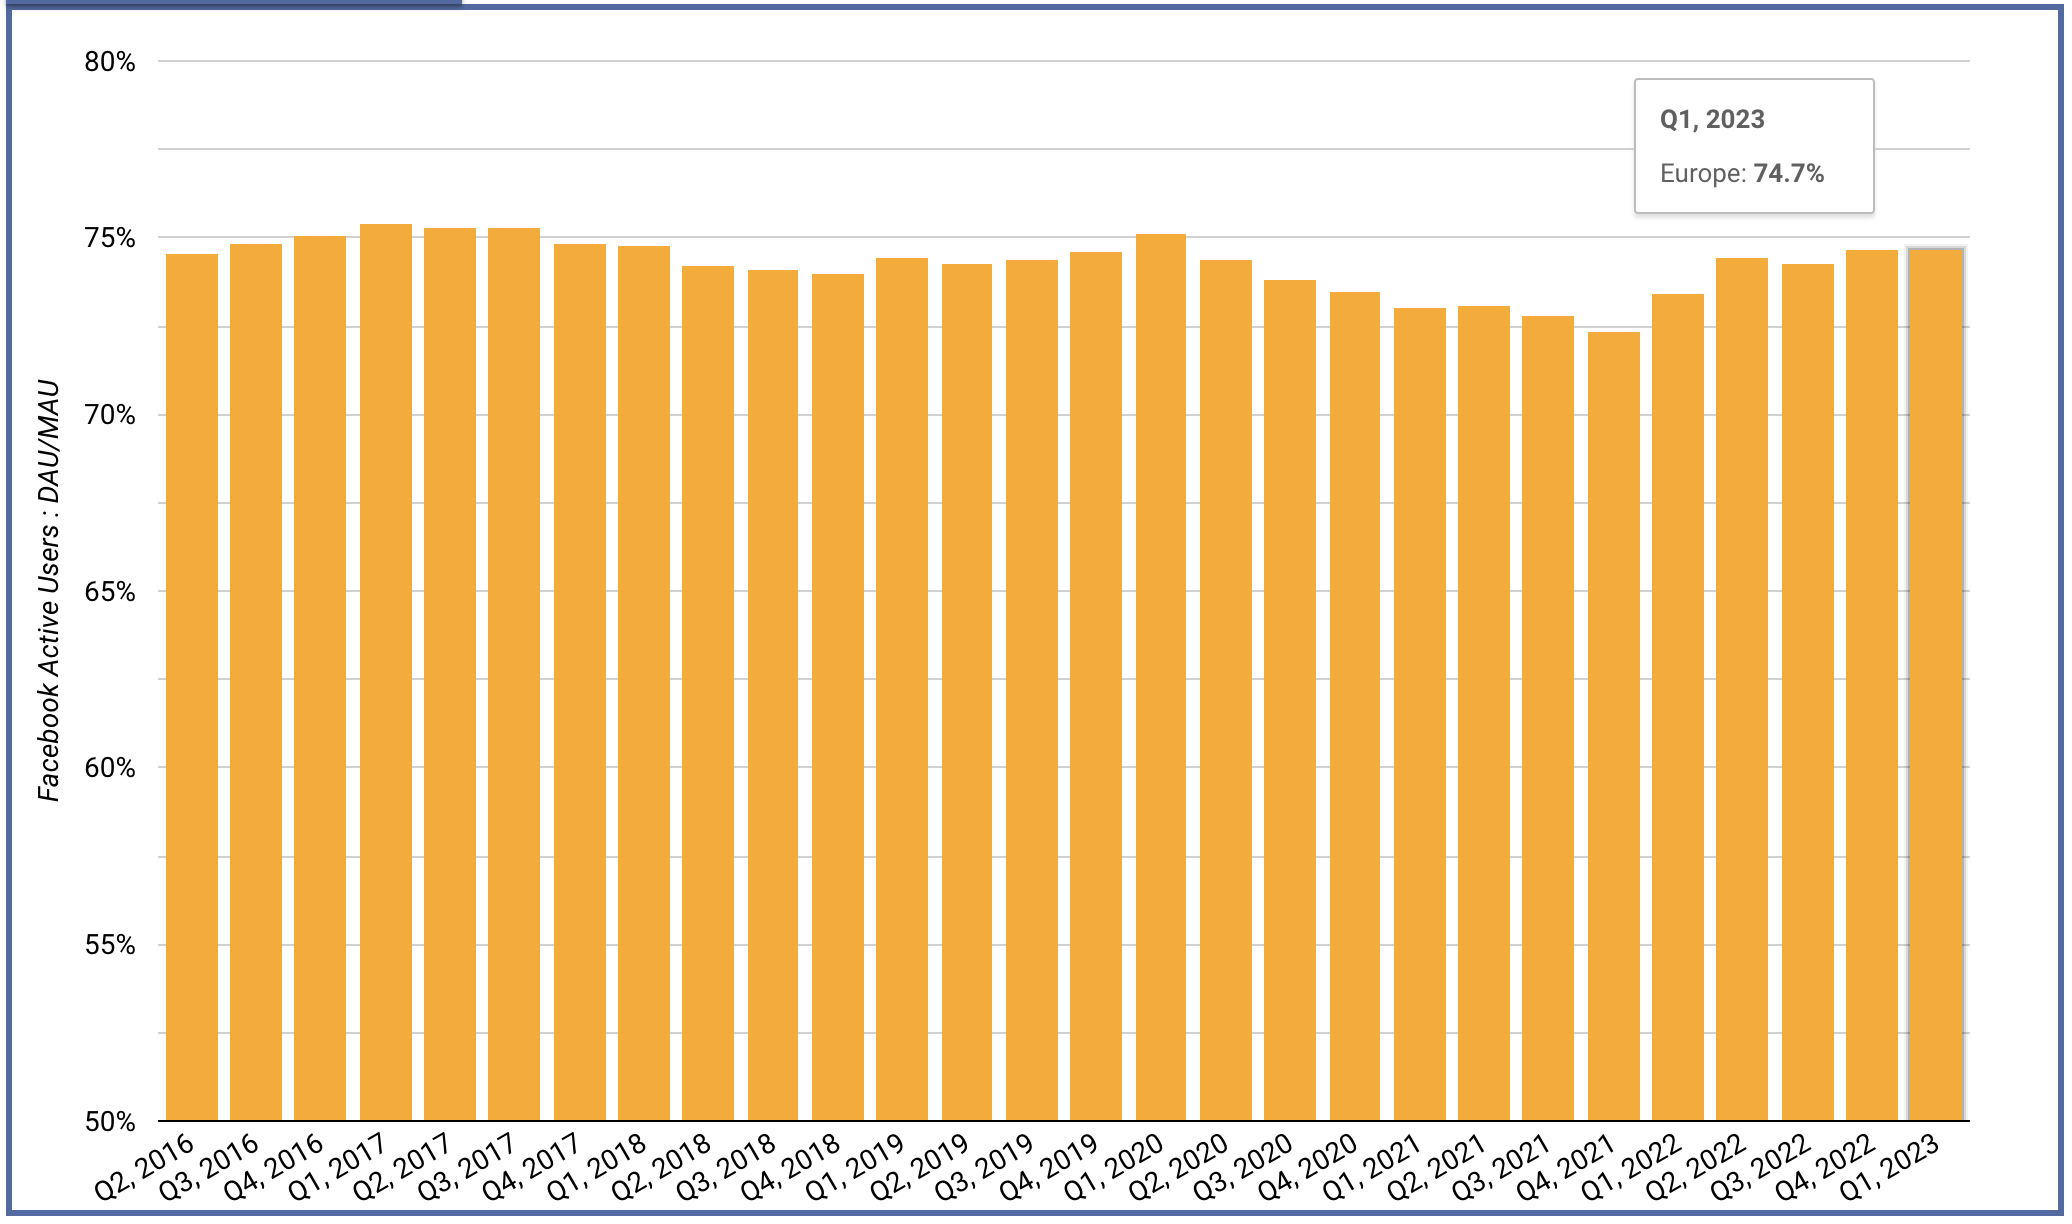
Europe has remained steady…
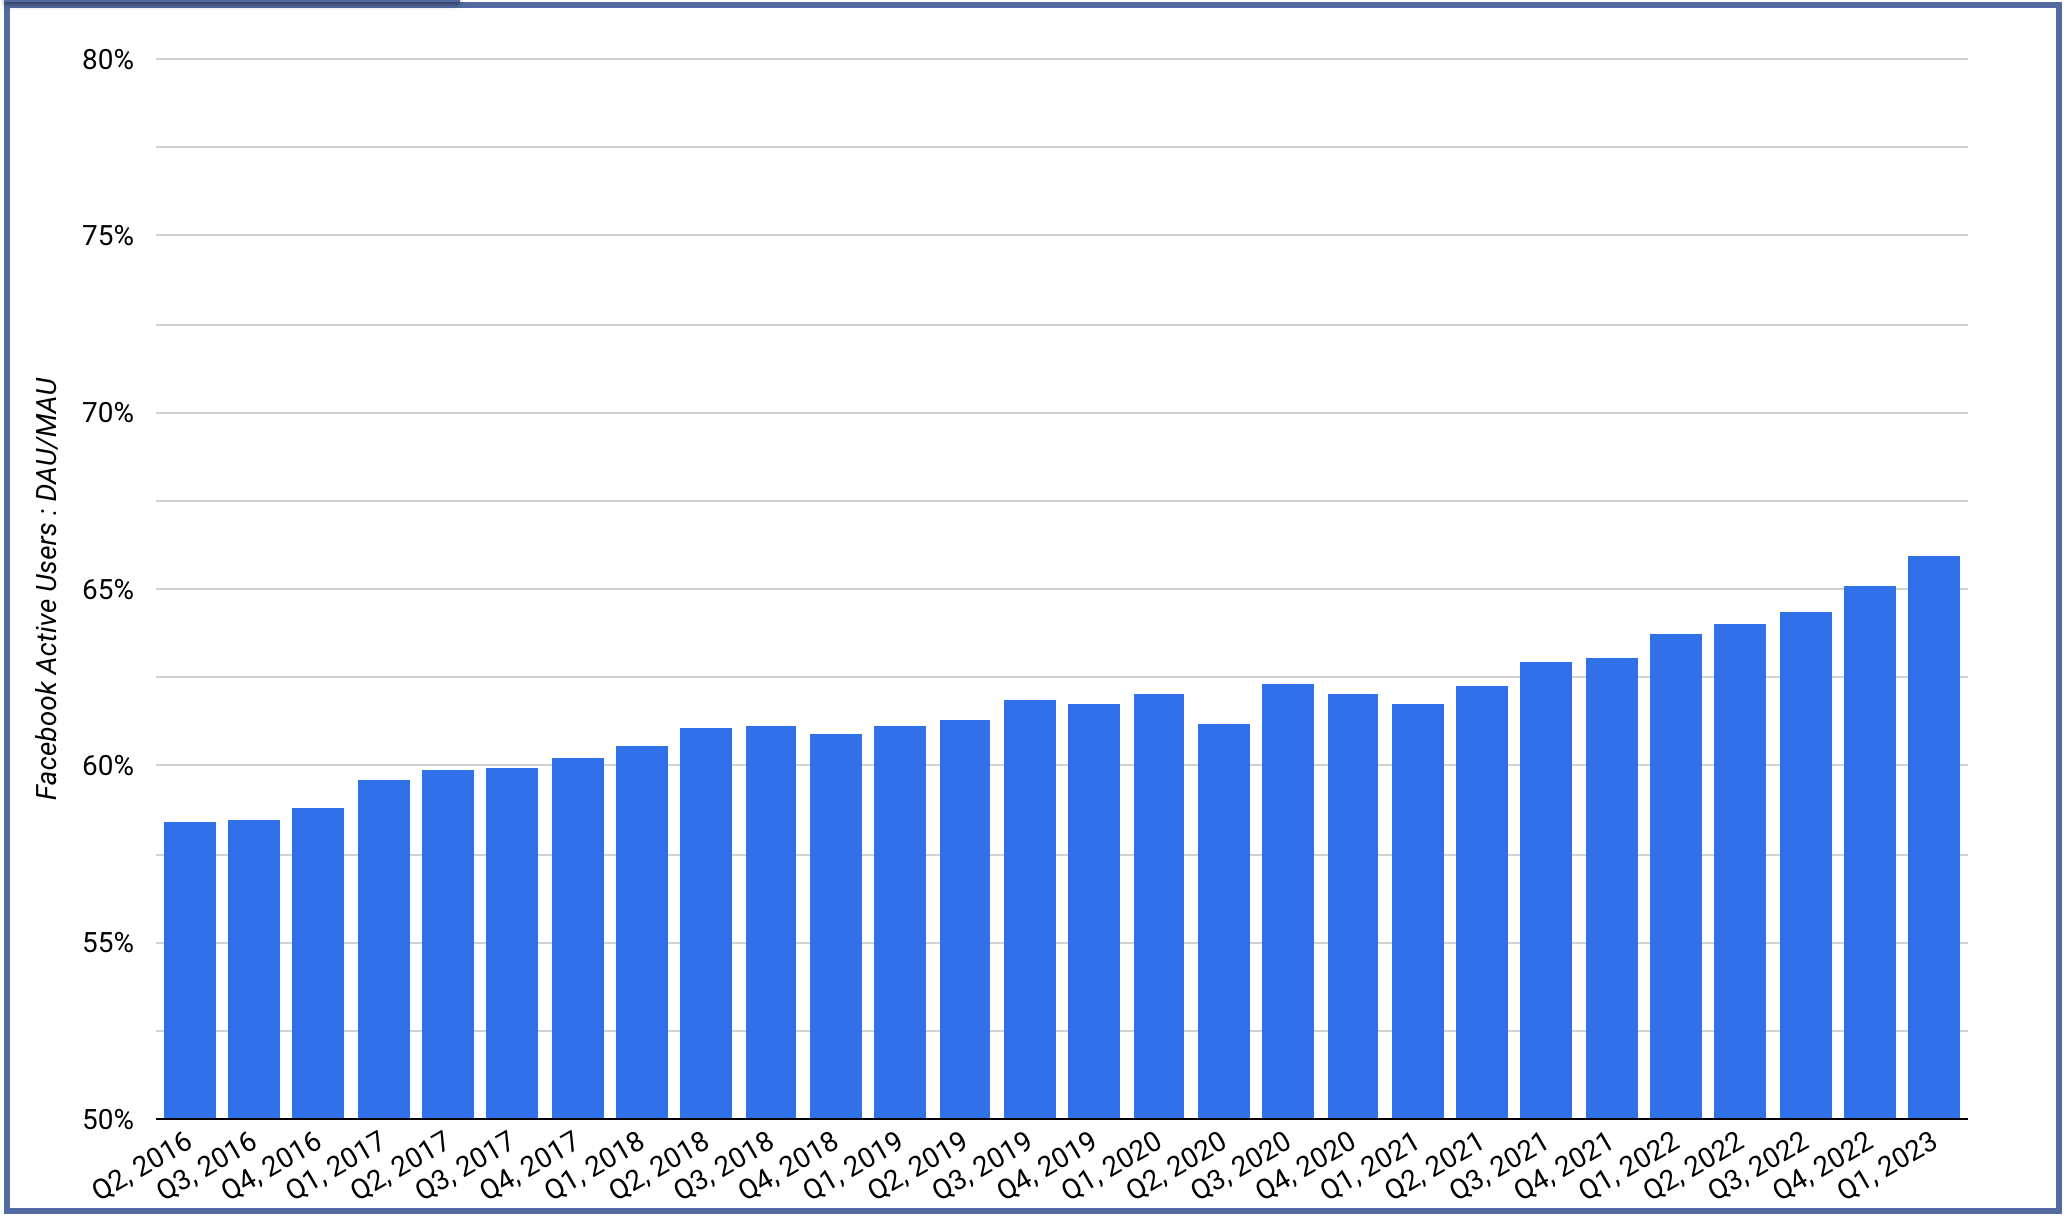
The biggest increases are in the Asia-Pacific…
And the rest of the world…
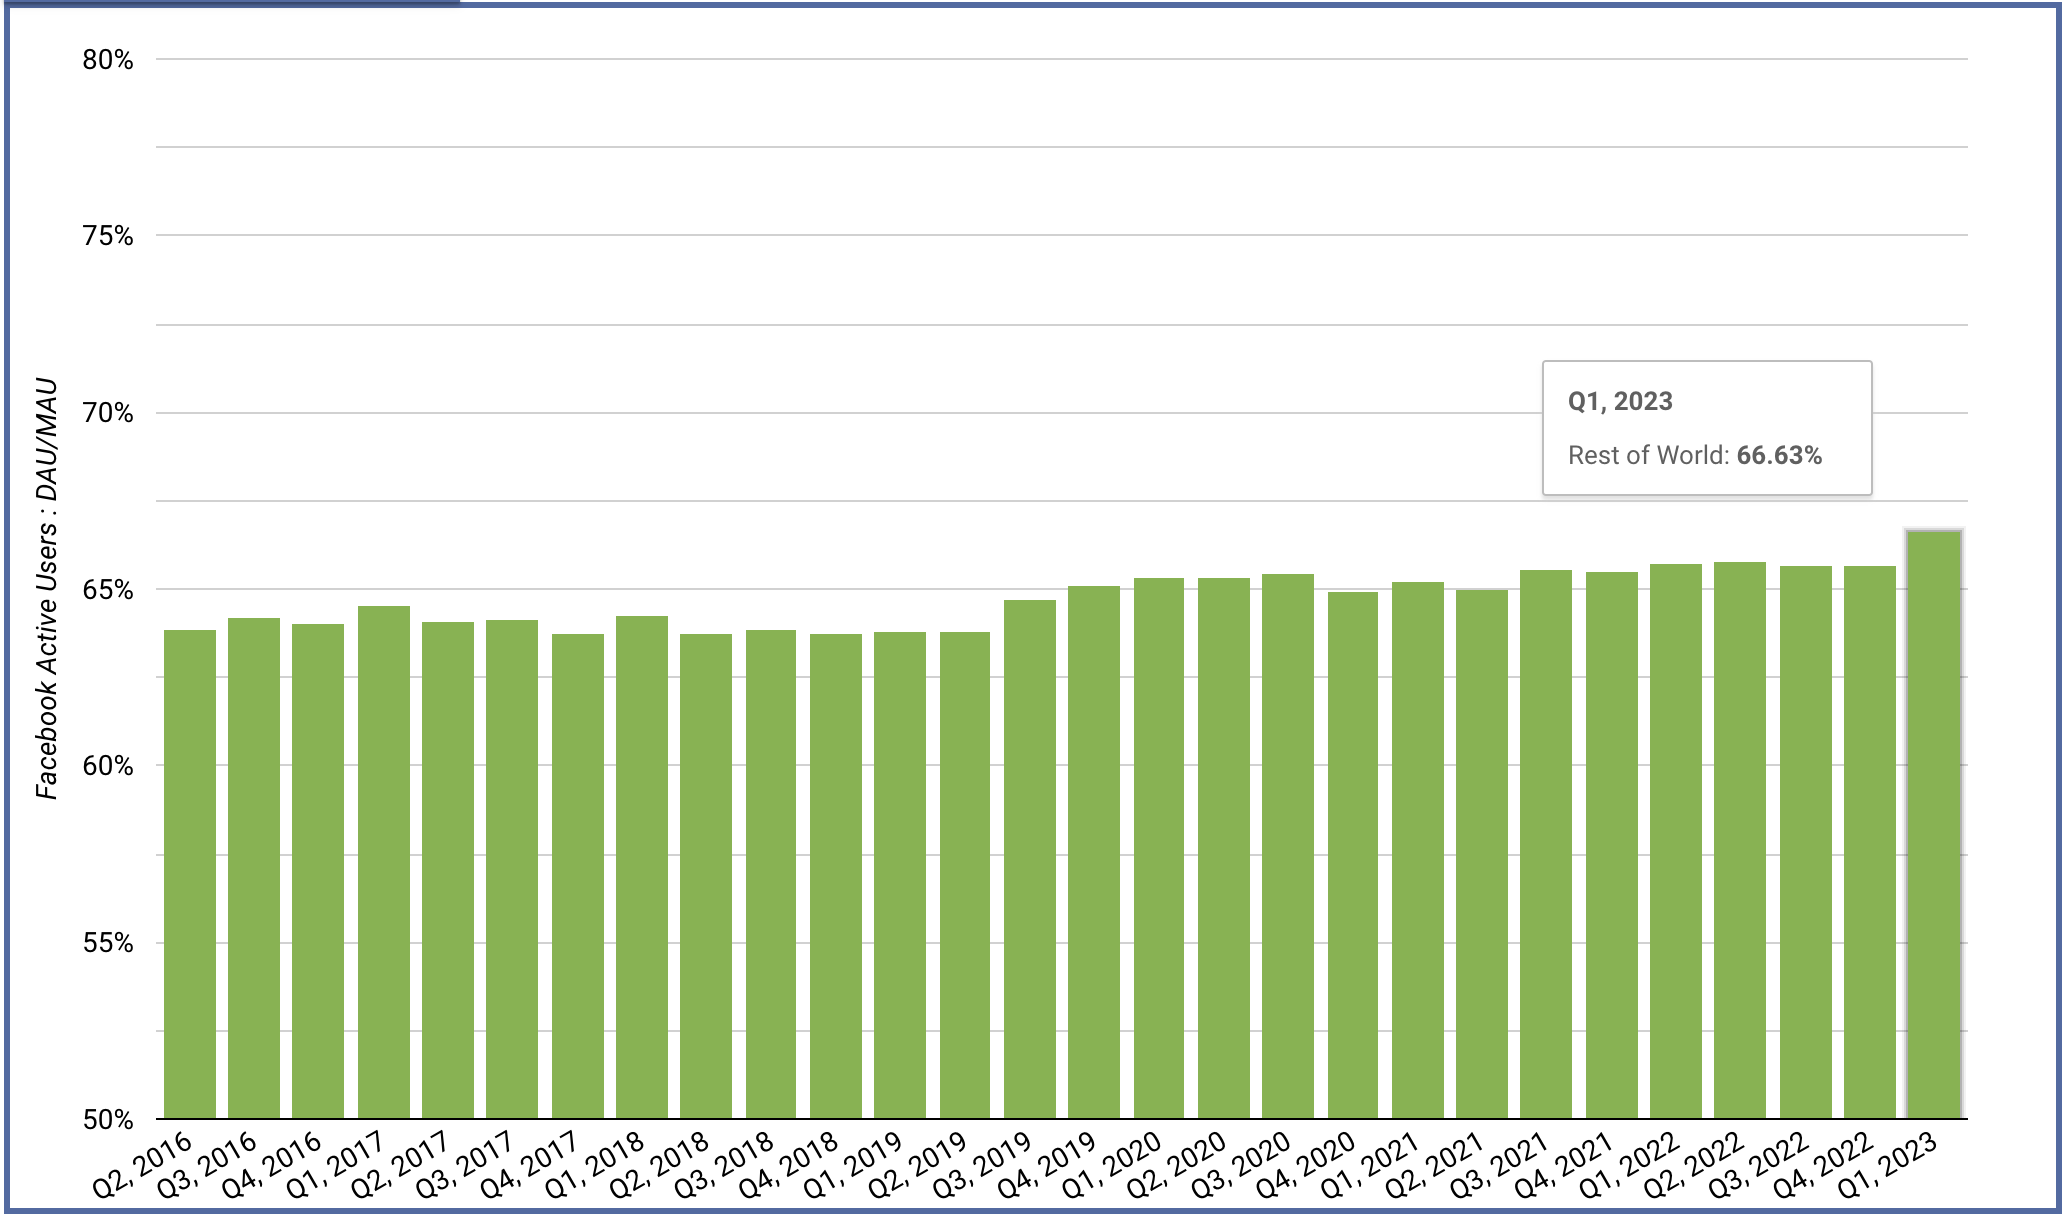
The overall increase in this percentage is attributed entirely to these areas.
This is relevant to ad costs for a couple of reasons. First, more time on the platform is more inventory, as we’ve discussed. But that additional time is isolated to these other countries which typically represent the lowest ad costs.
Why is user activity up? Well, it’s at least partially related to the increased popularity of Reels, which have exploded on both Facebook and Instagram. Because of Reels alone, there are sure to be more video ads than there once were.
It’s tough to say how significant increased activity leads to the 17% drop in ad costs and a 26% increase in impressions, but it is likely a factor.
More Ads Shown
While there are logical reasons for why there may be an increase in ads shown, let’s cut to the explanation that may be the most popular, controversial, and difficult to prove: Meta is simply showing ads more frequently than before.
I don’t mean that there are more places where you might see them (we’ll get to that). I mean that instead of seeing one ad every six posts in your news feed, now you’re seeing one every three (this is an example, it’s not factual).
If you were to ask Facebook and Instagram users whether they think they’re seeing more ads, you are likely to get a response in the affirmative. But anecdotal responses are far from scientific and don’t mean much.
But is this possible? Absolutely. We can’t discount it without more information from Meta.
More Placements
Meta can add more inventory without significantly increasing user growth or time spent by adding placements.
Of course, this is just a half step from the above possibility of showing ads more frequently. Either way, people are seeing ads more frequently than they would have before.
Yes, Meta has added several new placements during the past year, particularly within Instagram.
It’s certainly plausible, if not likely, that these new placements contributed to a decrease in ad costs and an increase in ad impressions.
Of course, something to keep an eye on is that Meta ended the Instant Articles placement in April. How much will that impact ad impressions and ad costs?
We’ll get our first glimpse when the Q2 report comes out.
Use of Advantage+ Placements
Is it possible that ads are shown more often in less competitive placements than they were previously? This could conceivably lead to more impressions and a lower price per ad.
It’s not only possible, it’s extremely likely that some of the “secondary” placements are used far more often now than they were a year ago. Whether or not this would have an impact on ad prices is for a smarter person to determine.
But, think about what’s happened during the past year. We’ve seen Meta test a series of tailored campaign setups that lock in defaults. In those cases, you aren’t even able to adjust your placements.
I’d also say that advertisers are now more likely to embrace Advantage+ Placements and allowing the algorithm to distribute their ads optimally. This was rare not too long ago when simply selecting News Feed only was common.
At least from an individual advertiser’s perspective who uses Advantage+ Placements more often, this does indeed lead to more impressions and a lower average price per ad.
The Importance of Ad Price
Finally, let’s remember that the average ad price is one of many factors that contribute to profitable ads. Advertisers often get lost in focusing on CPM, for example, prioritizing it in an attempt to improve performance.
The average ad price is interesting, but do not lose sight of the most important metrics. There are many different paths to a profitable Cost Per Action, and they don’t always run through a low CPM.
Watch Video
I recorded a video about this, too. Watch it below…
Your Turn
It’s possible that there isn’t a single factor that drives this. Instead, all or some of these factors may contribute to the drop in average ad price and increase in ad impressions. What do you think?
Let me know in the comments below!


