How did your advertising campaign perform? Part of the battle is knowing which Facebook ads metrics actually matter.
I’m often asked about what I care about. Facebook does a good job of surfacing metrics that are relevant to your objective, but that’s not good enough for me.
You can customize your columns in Ads Manager to include the metrics you care about most. You can also save those settings and make them your default.
Let me walk you through how to do that first. Then I’ll give you an overview of my saved settings that I call “The Good Stuff.”
Customize, Save, and Set as Default
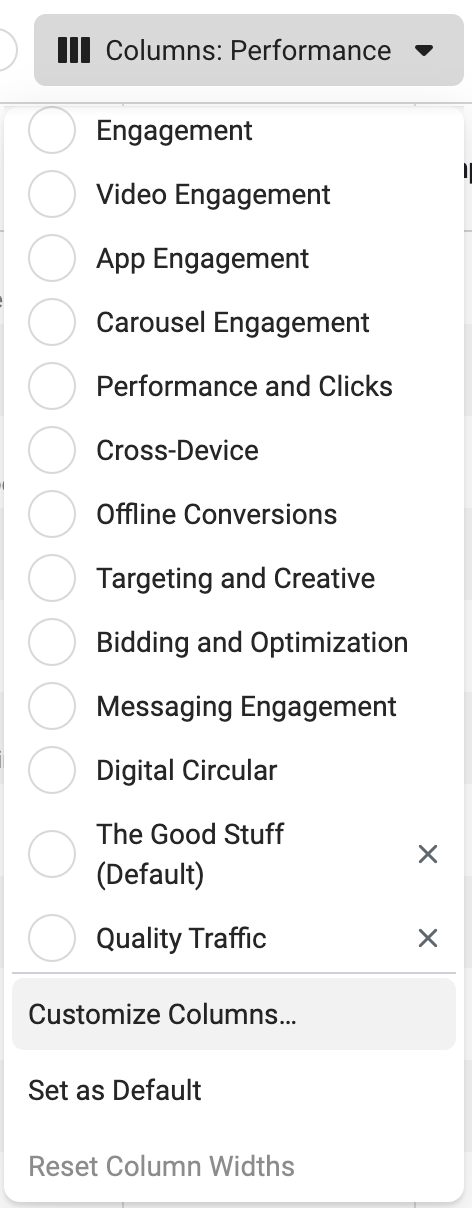
In most cases, the default column preset is “Performance.” This is a preset that Facebook created. If you click that drop-down, select “Customize Columns.”
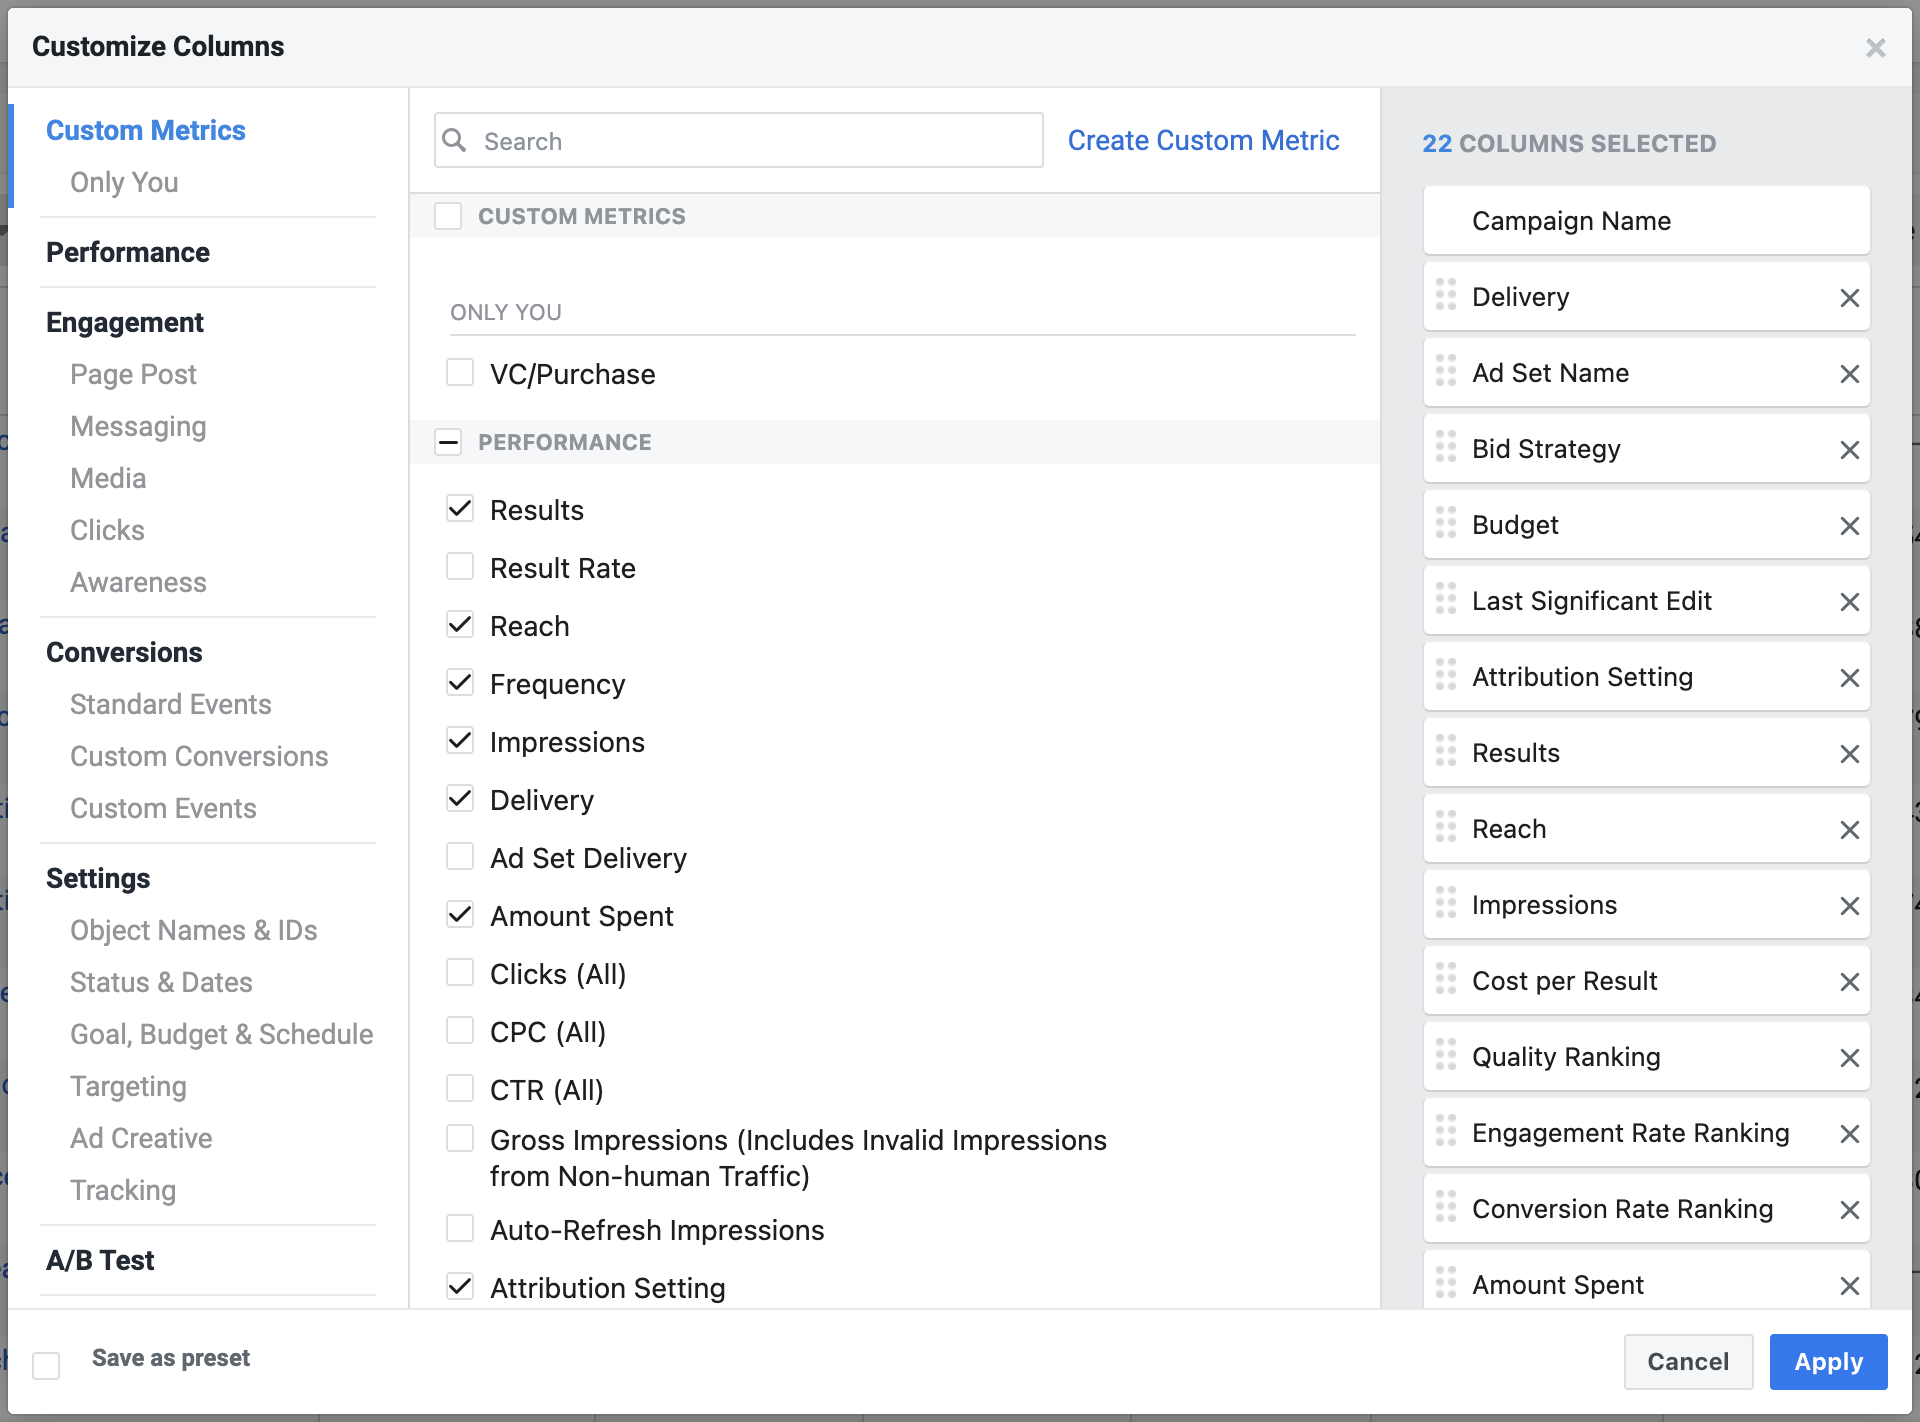
Then you can add and remove columns as you please. You can also drag and drop columns to prioritize what appears where.
Once you have a set-up you like, you can save it.
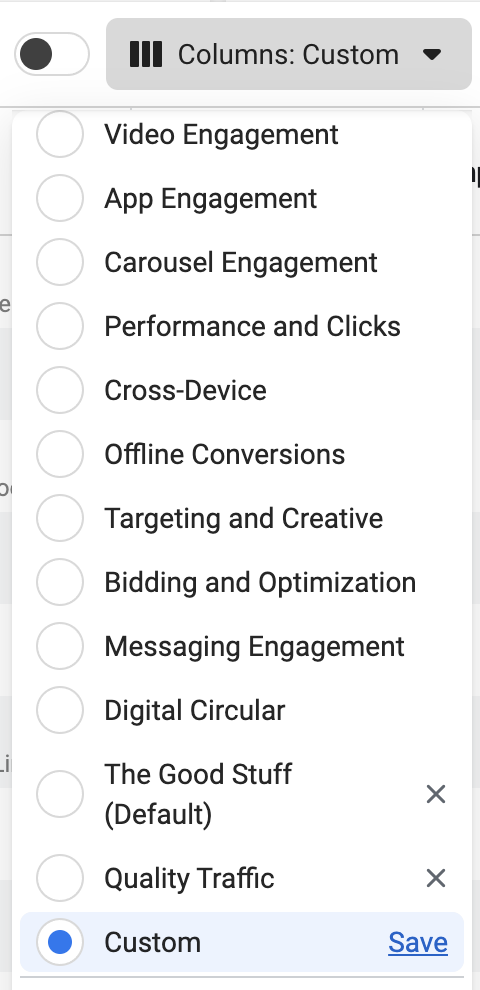
Click that drop-down again, scroll down to “Custom” and click the “Save” link.
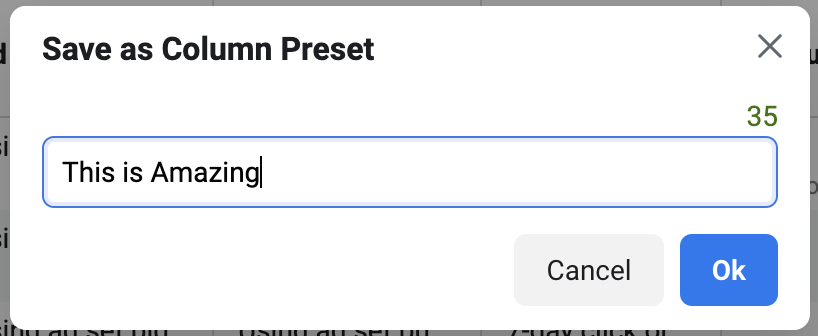
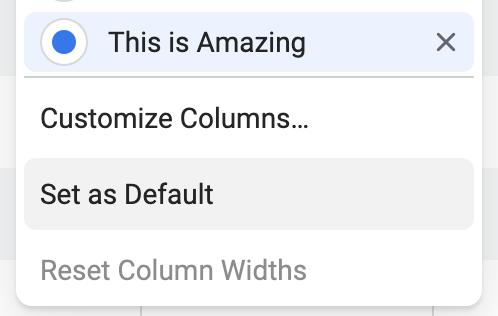
Give it an amazing name.
Once saved, you can then make that columns preset your default.
If you ever make a change that you want to save, just click into that drop-down again and click “Save.” Name it the same thing as the preset you previously created.
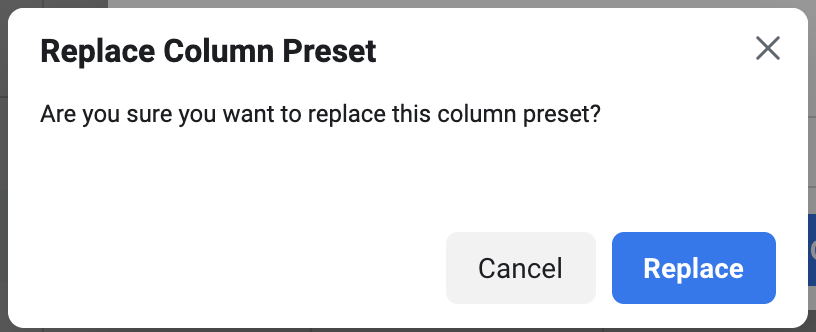
Then click the button to replace the existing preset.
“The Good Stuff”
My default column preset is saved as “The Good Stuff.” Basically, these are all of the main metrics that I care about most, regardless of the objective or optimization. It allows me to easily compare campaigns and ad sets without making changes.
I currently have 30 metrics in this setup. It’s a lot, I guess, but everything I need is there. If there’s ever something I need that isn’t included, I just customize columns.
To make it easier, let’s group the metrics I use by category…
Metrics: Campaign Basics
These metrics aren’t exciting, but they have to be included. Otherwise, you’d start asking questions.
They’re the campaign basics. The staples.
- Delivery
- Budget
- Amount Spent
- Results
- Cost per Result
Metrics: Reach, Impressions, and Frequency
I want to know how many people I’m reaching and how many times. But, it’s also really important to know how much it’s costing just to show these ads, both by impression and by person reached.
- Reach
- Impressions
- Cost per 1,000 People Reached
- Cost Per 1,000 Impressions
- Frequency
Metrics: Clicks
Not every click is the same, but I still like to see the reporting on each click type. I also like to see rate and cost metrics related to those clicks.
- Link Clicks
- Outbound Clicks
- Landing Page Views
- CPC (Cost Per Link Click)
- Cost Per Outbound Click
- Cost Per Landing Page View
- CTR (Link Click-Through Rate)
- Outbound CTR
Metrics: Standard Events
The standard pixel events you care about will differ depending on your website. The main two standard events that matter for my website are purchases and registrations. I could include ViewContent or Search pixel events, but I’m just not prioritizing them.
- Registrations Completed
- Purchases
- Cost Per Registration Completed
- Cost Per Purchase
- Purchase Conversion Value
- Purchase ROAS
Metrics: Custom Events
I’ve created three different custom events. I track quality traffic with the Time on Page and Scroll Depth events. I also have a custom event for embedded YouTube video views, but I just don’t prioritize that event.
Maybe you use different custom events. Maybe you don’t even use custom events. Feel free to track custom conversions, too, if they matter to your business.
Here are my metrics that matter related to custom events:
- Time on Page Event
- Scroll Depth – 70%
- 60 Seconds Time on Page AND 70% Scroll Depth
- Cost Per Time on Page Event
- Cost Per Scroll Depth – 70%
- Cost Per 60 Seconds Time on Page AND 70% Scroll Depth
Find What Works for You
There’s a ton of room here for adjustments. I guarantee if you ask me a month from now, I’ll make changes to this. Most likely, that would be due to adding custom conversions to monitor more specific conversions.
But the main point here is finding the metrics that represent “The Good Stuff” for you. Save it. Default it.
It makes the Ads Manager experience so much easier.
Watch Video
Your Turn
What metrics would you include in “The Good Stuff?”
Let me know in the comments below!


