[The following is a guest post from Dennis Yu of BlitzMetrics.]
If you manage a Facebook page that is local, ignore this article.
But if you operate in multiple cities or multiple countries, pay close attention.
Facebook does report on your top countries and top cities — but only the top 20 of them. That’s 176 short, based on the widely accepted count of 196 countries in the world. To see this, go into your insights, where you’ll see it broken out by fans, reach, and storytellers.
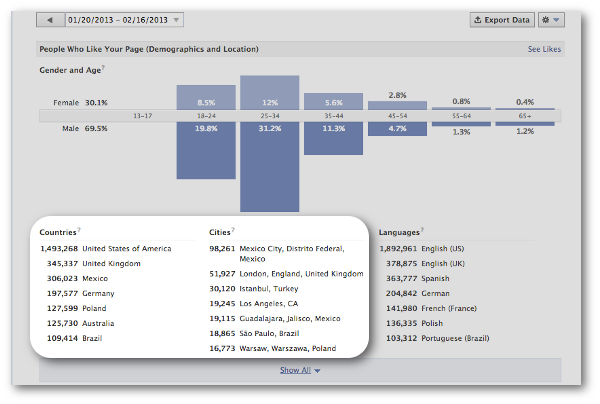
Now click “show all.”
So if you are a global brand — perhaps you have global pages for each of your products or even have multiple regions by category — what do you do?
Workaround #1: Make sure all posts are either global or target just one country/language.
This way, you can assume all traffic on a post hits just that country. For global posts — you’ll just have to assume that the countries not in the top 20 have the same reach and engagement. Yes, that is a tough assumption.
But if you must provide some level of reporting to your country level teams — perhaps they are compensated by social KPIs — then they’ll likely quibble with you if the numbers are not in their favor.
Workaround #2: Pull public graph API data. You can get user-level interactions on posts, comments, comment likes, and likes. If you go to graph.facebook.com/dennisyu, you’ll see mine…
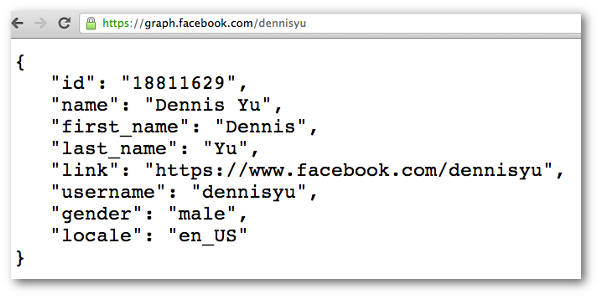
Note the locale field, which is a combination of the language and the country code. A lot of people get this wrong — so make sure you read this carefully.
For the most part, Facebook does follow the international two digit country standard. Note their documentation says the locale is language, then country, plus LA and AR being “Latin America” and “Arabia”. These each stand for a lot of countries.
It’s not exact on country — your friends in Australia will likely be under GB. But this will get you an additional 50 countries via a rough estimate.
This is not exact. The only way to get the exact data is if Facebook provides it. We’ve let them know about it since 2008 and it’s on their radar to provide, so don’t kill the messenger.
Workaround #3: Facebook ad tool
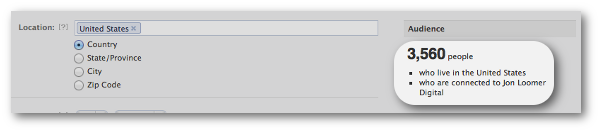
Did you know that Facebook’s ad tool provides surprisingly good audience counts?
Go into facebook.com/ads/create and pretend to make an ad using your page as the destination. Don’t worry — you won’t actually submit the ad. You’re doing this just to get the counts.
For connection targeting, choose fans of your page.
Then go one country at a time to get your counts.
The numbers here will be slightly different than your insights figures for a few reasons:
- There is a longer data delay on refreshing audience counts for the ads tool. Let’s say you just launched your page and have grown from nothing to 10,000 fans in the last couple weeks. The tool might still show “less than 20” for a while until they refresh the counts. So the faster your growth rate, the more the numbers will deviate.
- Your audience is super small. If your fan base is under 10,000, then Facebook’s system will have trouble giving you stats on the smaller countries that might have only a few fans or PTAT each. There is some sampling going on, of course. To run the exact numbers each time on a billion users would be prohibitive.
- You have some weird targeting or restrictions. Did you leave the default at 18+? That will automatically grab 17+, as opposed to 13+, which would be the entire audience. Maybe your page has a restriction related to gambling or alcohol.
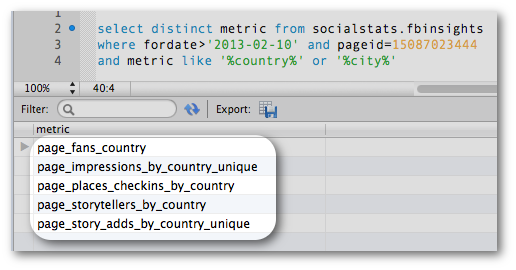
Workaround #4: Use the insights API
Just like workaround #2, you’ll have to have some handy programming skills or access to a friendly developer. There are 45 countries you can get from insights if you use the API. That’s more than double what you get from the web version of insights.
Don’t ask me why — I get asked this all the time. There are just a lot more metrics and data in the insights API, period.
In fact, here are the metrics you can get at the page level:
And here’s what you get at the post level:
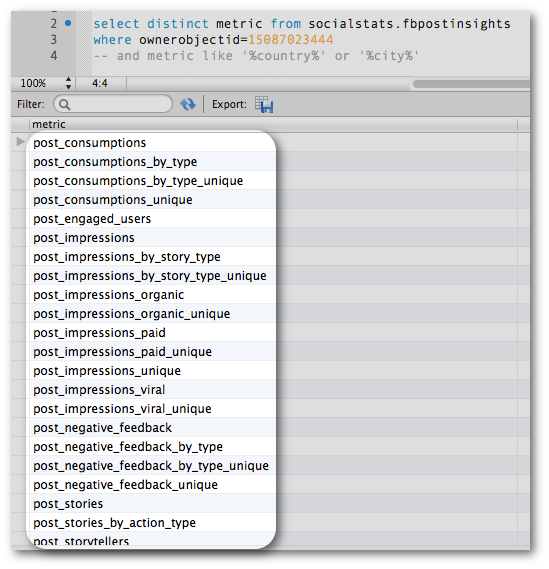
As you can see, no city or country level data by post.
So if you can’t pull from the graph API or get someone to do this for you, then options 2 and 4 are off the table. Not hard to find a freelancer to do it for you for a couple hundred dollars, by the way.
And if you don’t have “that” many countries you care about or don’t need precision, then option 1 is probably enough.
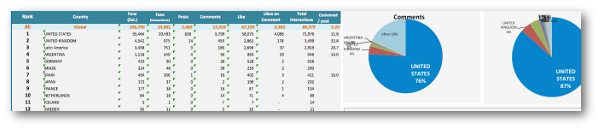
Do this. Sum up the fans of your top 20 countries and compare that against your total fan base. I’ll bet the top 20 is over 93%. We’ve done this many times.
Ask yourself if you need precision in the last 7% or so of your user base. Then again, you might need to report on this for political reasons, since you don’t want to anger your colleagues in Japan or South Africa.
And it’s not even fans that matter anymore — it’s about newsfeed coverage and engagement rates. Facebook’s ad tools do report on country and city at the finest grain. You’d expect this, right?
A few months ago, Facebook said they’d release fans and PTAT by country as a public metric for all pages. That means you can get these counts for your competitors — no insights token needed. What we’re hoping for is to see this go to all countries, not just the top couple dozen.
Still with me? You’re a trooper. Now let’s talk about how to interpret the data.
Not only will the US likely be your dominant country (or whichever your primary country), but you’ll find that fans in Latin America are more likely to click like than comment by an order of magnitude.
Same thing with women, as well as folks who are younger.
You might use this insight to tune your content, knowing that you’ll have to position content differently to get more interactions by country.
If you’re a real pro, you’ll look at your insights — in particular, impressions by story type, to see how much more impact a comment has than a like, or a share vs a comment.
I’ll go ahead and save you some time. The comment is about 7 times more powerful than the like, based on how many impressions it generates in the news feed. And the share is worth as much as two comments.
Now you can calculate the newsfeed impact of any post. You can think of this as a more useful version of EdgeRank.
In full disclosure, pulling graph data is what our company specializes in. We are releasing the very tools we’re talking about above for free or nearly free. If you want to play in our beta, contact me.
Data geeks or just the data curious– what do you think of all this?

Dennis Yu is a Facebook ads and analytics geek, founder of BlitzMetrics, and connoisseur of chicken wings across the globe. Formerly of Yahoo!, he has been featured in CNN, the New York Times, Wall Street Journal, LA Times, NPR, and other media. Catch him on Facebook, LinkedIn, or his blog.