You should be skeptical of too-good-to-be-true traffic results coming from Facebook ads. Don’t just trust that those clicks and landing page views are highly-engaged users. There are ways to check.
We’ve discussed the pitfalls of optimization before. When you optimize for engagement, links clicks, landing page views, or any other surface-level actions, Facebook doesn’t care about quality. Not one bit.
If you tell Facebook you want link clicks, the algorithm will do everything it can to get as many of them as possible for the lowest cost. It doesn’t matter whether they are accidental clicks or three-second views. The optimization, in Facebook’s eyes, did its job.
But you care about quality. You know that a quality visitor is someone who has the potential to return to your website. A quality visitor may want to join your email list. And, of course, a quality visitor may actually buy from you. If not today, one day.
So, how do we verify the quality of your traffic results? Let’s discuss a couple of primary ways…
Add Columns to Your Reports
When you run a traffic campaign, Facebook will report on the metrics that are related to traffic, by default. But, is that all that matters?
Customize the columns of your report.
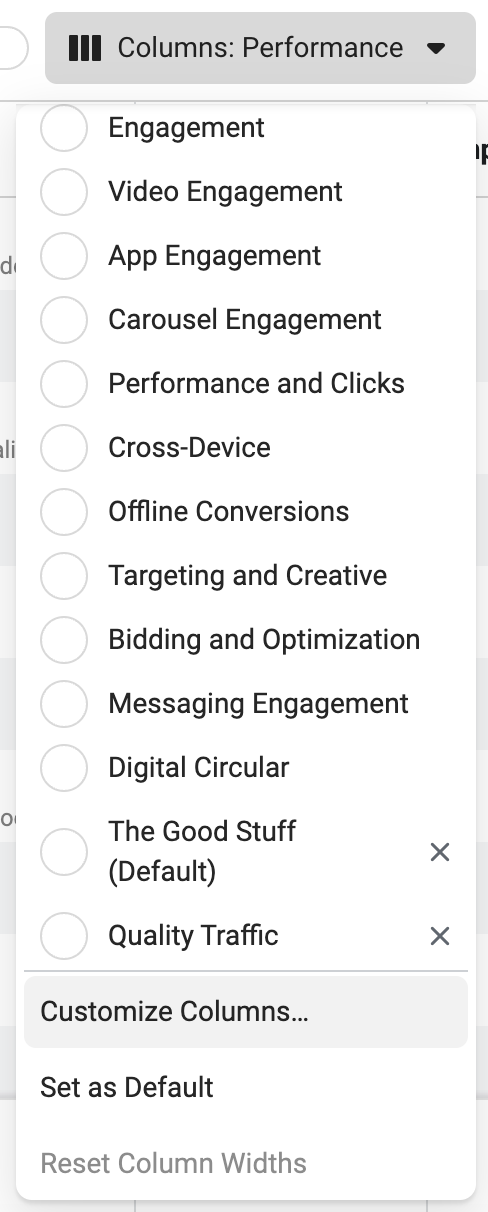
Then you can add or remove any columns that you want.
Think about what you consider a quality website visitor:
- What do they do?
- What might they do?
- What do you hope they’ll do?
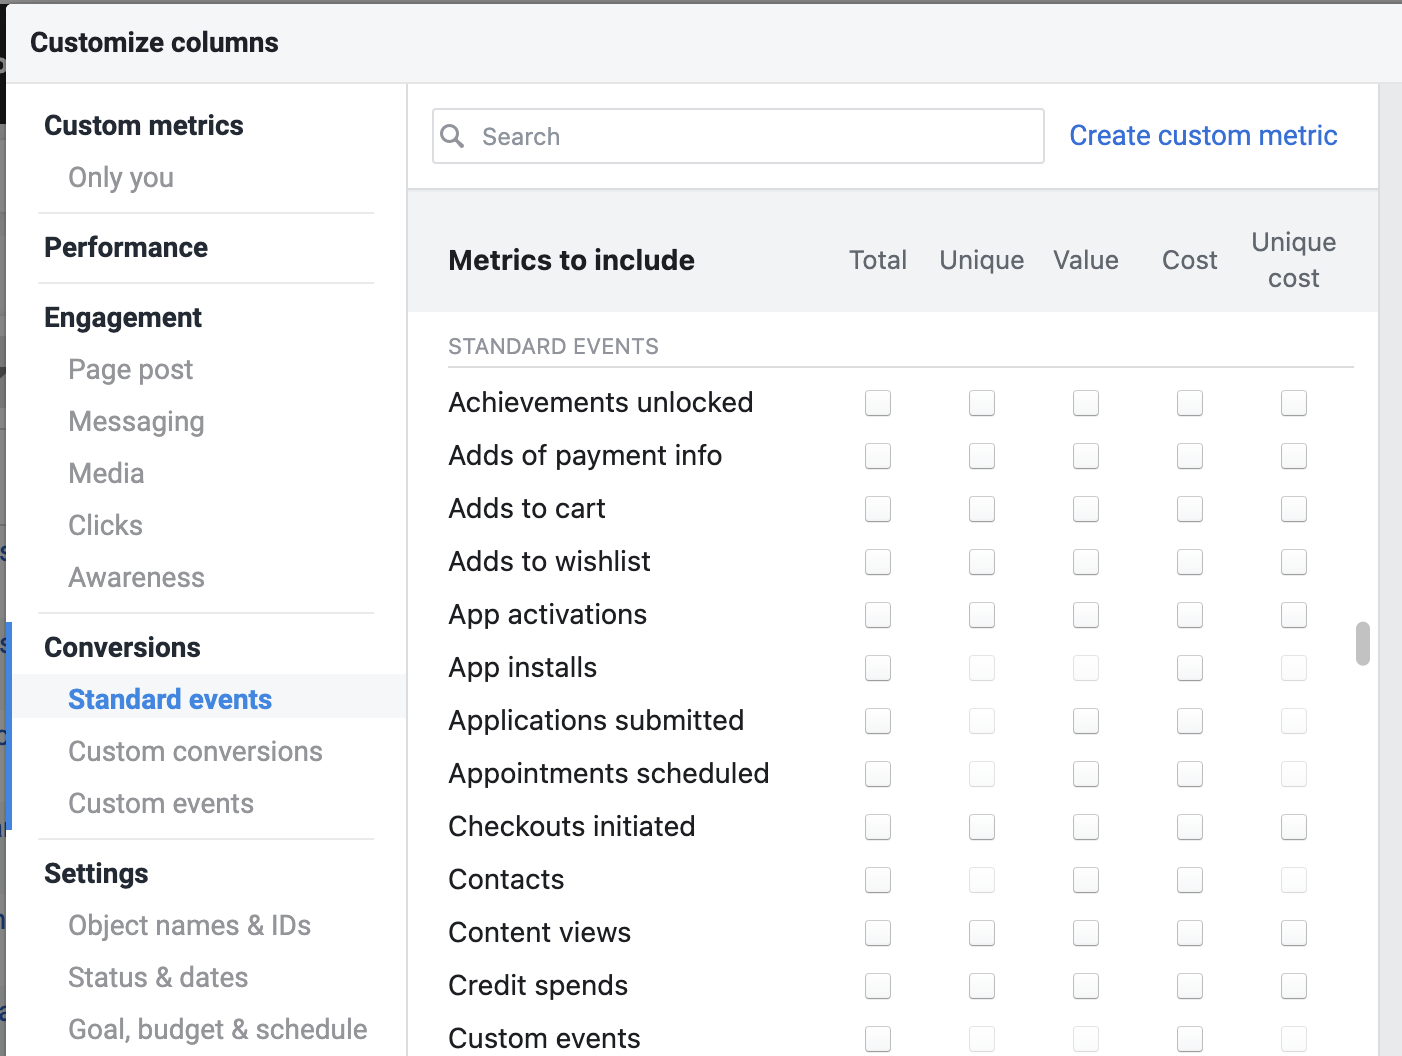
A good place to start will be any standard events that you may have created so that you can track all registrations, searches, leads, purchases, and more that result from your campaign. If possible, start with ranked events, as data is more likely to be complete.
Have you created custom events for quality web activity? This is certainly one solution.
Here are some events I use:
- 2-Minute Time on Page
- 70% Scroll Depth
- Viewed 2+ Pages in a Session
- Viewed an Embedded YouTube Video
- Started my Audio Player
All of these actions are indicators of a quality website visit. Compare the results of these quality actions in this campaign to other campaigns.
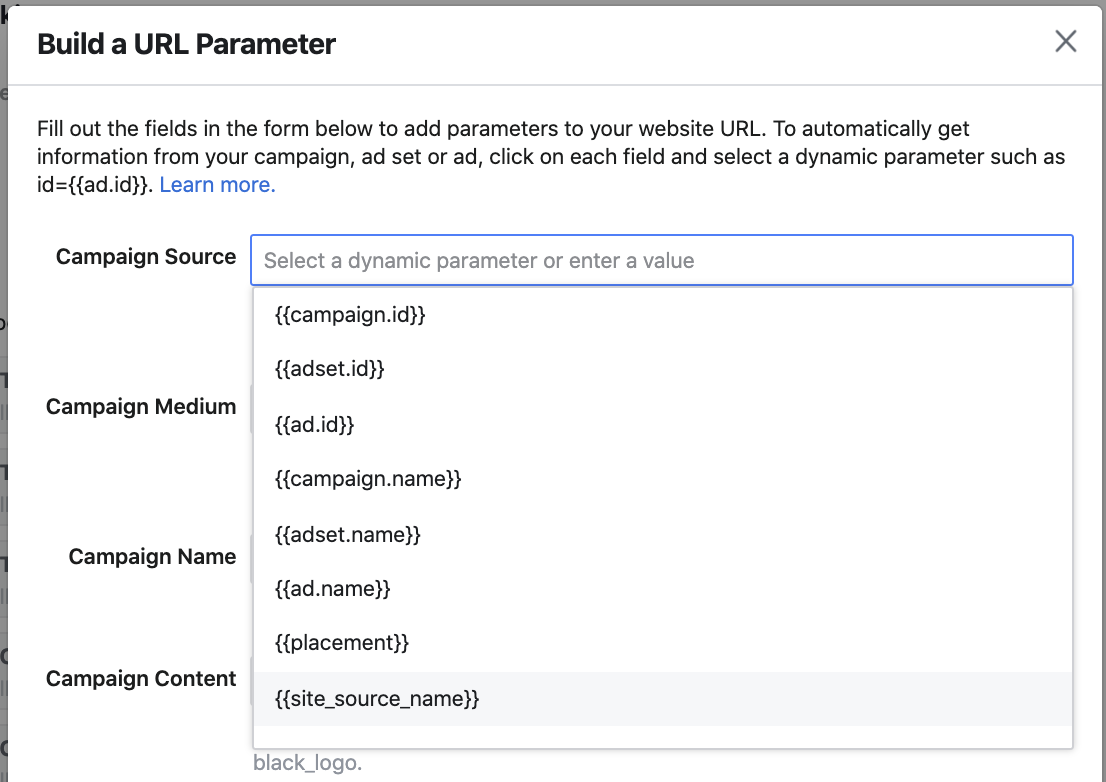
URL Parameters and Google Analytics
I’ve written before about how to use URL parameters and Google Analytics to check your results. I’ve also provided an example of how doing so uncovered conversions that Facebook wasn’t reporting.
Set up your URL parameters however you’d like, but I prefer the Dynamic URL Builder that Facebook provides within ad creation. You can have it automatically pull information like the campaign name, ad set name, placement, ad name, and more.
And then, you can check the traffic that comes from people arriving from that link within Google Analytics. Go to Acquisition > Campaigns > All Campaigns, and you can then view information like bounce rate, average session duration, and the number of goals completed (assuming you have set goals up).
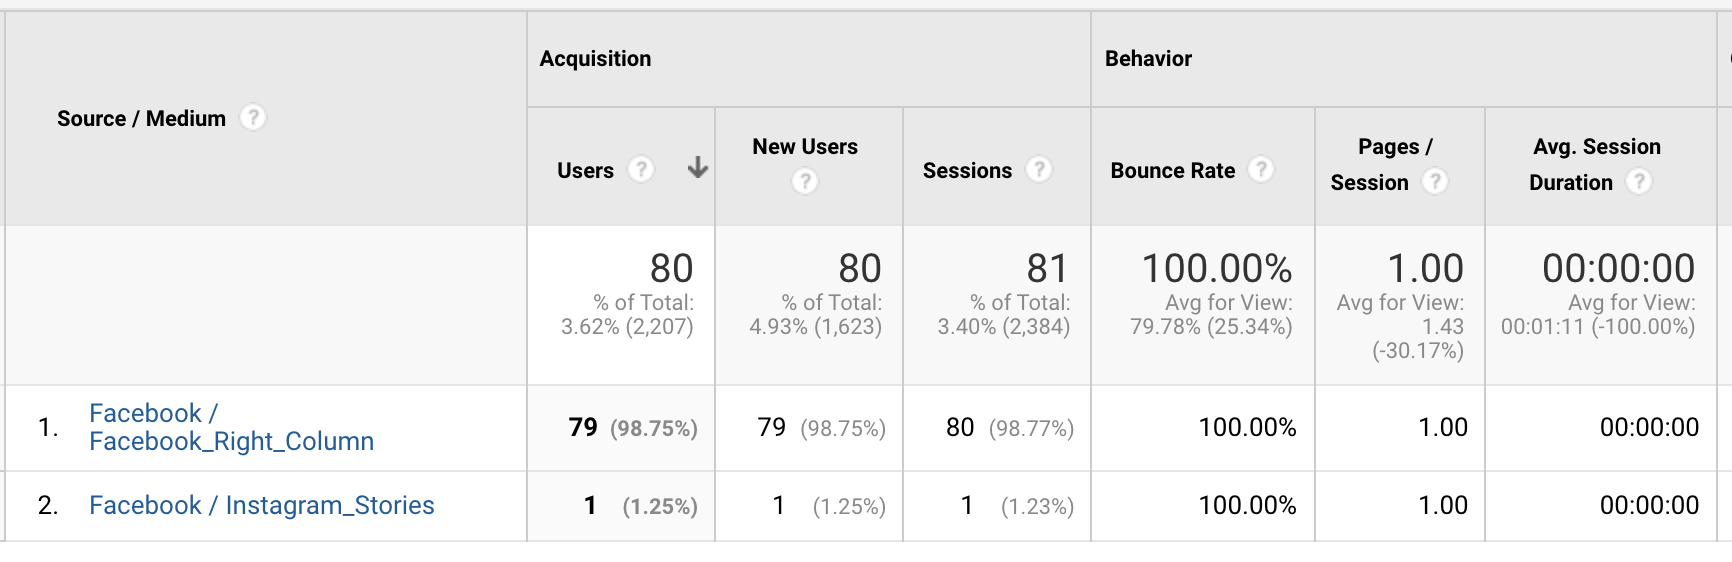
Once again, compare this information to your typical traffic — or maybe even typical referral traffic, or referral traffic from Facebook. What do you expect for bounce rate, average session duration, and conversion rate on goals? How does this campaign compare?
Example
This post was actually inspired by an eye-opening discovery that I made with one of my campaigns. Allow me to explain what happened and how I detected the problem.
My goal was to drive website traffic to my blog. I started with a traffic campaign that optimized for landing page views and would ultimately try several variations that were conversions campaigns optimized for quality traffic metrics (based on custom events for scroll depth, for example).
The campaign would send close to 4,200 people to my website. The cost per landing page view was pretty good, but something didn’t feel right.
After determining that the average conversion rate (any conversion) on my website for all traffic was about 3%, I set a low bar expectation for this traffic to drive 1% of those 4,200 users — which would have been 42 conversions.
I added columns to my report in Ads Manager. No purchases. No registrations. Only three searches.
Since I was using URL parameters, I then checked the campaign in Google Analytics. Not a single conversion. Nothing. Nada. Facebook didn’t even luck into sending me someone who would convert.
It raised some red flags, to be honest. But, that’s a whole different conversation. The main point here is that I didn’t rely only on Facebook’s default reporting. If I had, that campaign would still be spending.
Make sure that you know what metrics you’re looking for and have multiple ways to check the quality of your results.
Your Turn
Have you had issues with the quality of traffic sent by Facebook ads? What did you do?
Let me know in the comments below!


