Any screenshots and details of functionality may no longer be relevant. Below are some related posts that are more current:
- Common Audience Segments Failures (Jun 7, 2026)
- Meta Ads Attribution Reporting: What Your Results Really Mean (Jun 2, 2026)
- How to Track Quality Traffic Percentage (May 24, 2026)
We’ve been hearing for quite some time now about the effectiveness of running Facebook ads on mobile devices or in the desktop News Feed. But the sidebar? “Completely worthless!” they shout.
But is it true?
It’s conventional wisdom that it is. And maybe it’s true when applied to the general population. But sometimes you need to double check conventional wisdom to make sure it applies to you.
That’s why I decided to take a closer look. And what I found is likely to surprise you.
First, Some Perspective
It’s always important to point this out from the start. We’re talking about the results for only one Page during a three month period. Sample size, industry, copy, landing pages, products and a whole lot more factor into these results.
I have decided to focus on all campaigns that I ran with the intention of one of the following things:
- Conversion (Checkout)
- Conversion (Registration)
- Page Like
I eliminated any Promoted Post that was created for the purpose of engagement, but still managed to receive one of these actions.
The four main countries I target in my ads are the United States, United Kingdom, Australia and Canada. As a result, cost per action will always be higher.
I know. You can get ridiculously low Cost Per Like. But I’m focusing on quality over quantity here. As a result, costs are higher (but you’ll see results follow).
My total ad spend in this case study is $4,212.30. It is broken down as follows:
- Desktop News Feed: $2,473.92
- Mobile: $1,194.38
- Sidebar: $544.00
Shortly, you are going to see why I believe I should be dedicating far more of my ad spend to the sidebar.
How I Did This
If you aren’t using the new Facebook ad reports, you need to do it now. This is how I’m able to break down what my Cost Per Desired Action is by placement.
No, I didn’t create a different ad for each placement. Facebook breaks all of this down for me, which is incredibly valuable. It now allows me to optimize and spend my money more efficiently based on the results.
Cost Per 1,000 Impressions by Placement
I took all of the ads run during the past 90 days and found the average CPM based on placement.
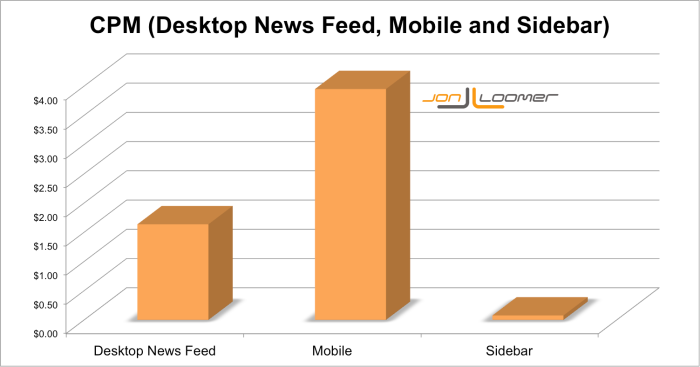
It is as follows:
- Desktop News Feed: $1.64
- Mobile: $3.95
- Sidebar: $.08
Keep in mind that this is an average covering all targeting. So when I target Fans only, for example, these will be significantly higher. But I also target large pools of non-Fans to bring the average price down.
You probably aren’t surprised that mobile CPM is the highest here, and it really isn’t close. I’ve actually seen sidebar CPM below $.05 in many cases.
Let’s think about what this means. While Mobile or Desktop News Feed may (not confirmed yet) result in more desired actions per impression, the significantly higher CPM means that you are going to pay 20X or more for each impression. So in the end, the sidebar could be most efficient.
And I have a feeling that’s what we’re going to see!
In order to analyze the results for checkouts and registrations, of course, I’ve been using Conversion Tracking. I hope you are, too!
Cost Per Checkout by Placement
Following is a chart showing the Cost Per Conversion of my campaigns that were run for the sole purpose of selling during the past 90 days. I spent a total of $520.29 on these ads.
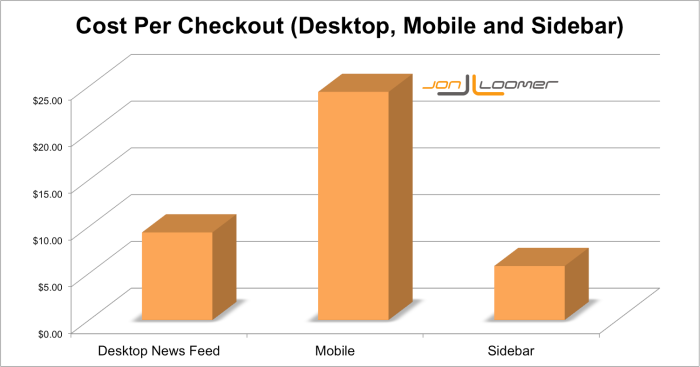
Here are the actual costs per conversion:
- Desktop News Feed: $9.37
- Mobile: $24.39
- Sidebar: $5.78
You’ve probably heard my story about getting a 35X ROI during the first month of promotion of my Power Editor training course. Facebook ads are pretty darn powerful!
Of course, I haven’t been able to maintain that ROI. But keep in mind that the following CPA numbers are going to be for products that were sold at either $73.50 or $147.
In most cases, I’ve stopped ads that go to mobile devices. While a CPA of $24.39 isn’t a negative ROI by any stretch of the imagination, it’s nowhere near as efficient as desktop.
But sidebar is most efficient? I did not see this coming!
Cost Per Registration by Placement
I’ve also been running ads with the goal of driving registrations to my weekly webinar. I have spent $576.69 on these ads.
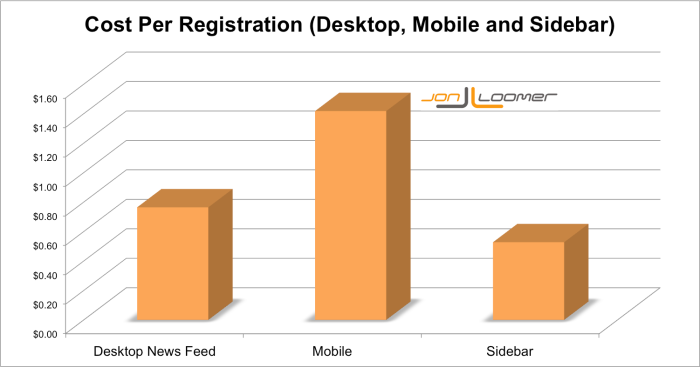
Here are the actual costs per registration by placement:
- Desktop News Feed: $.76
- Mobile News Feed: $1.41
- Desktop Sidebar: $.53
Once again, mobile is far more expensive than the other two placements, and the sidebar ends up being most efficient. Unfortunately, I was only putting $25.83 of my budget towards the sidebar (that will change!).
Page Likes
I am constantly running campaigns to increase Page Likes. I have spent $1,788.33 on such ads.
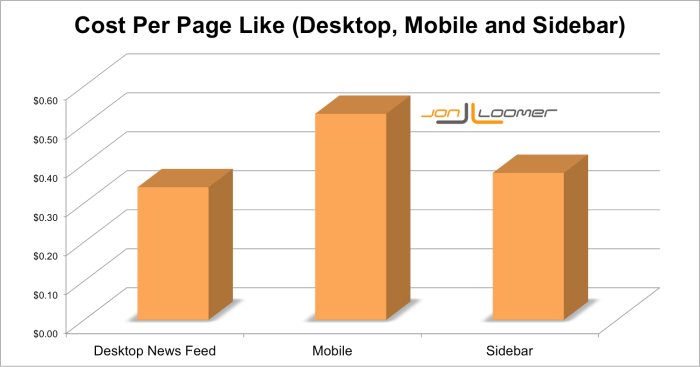
Here are the actual costs per Page Like:
- Desktop News Feed: $.34
- Mobile News Feed: $.53
- Desktop Sidebar: $.38
Mobile isn’t a complete waste this time, but these ads were still most expensive. The desktop News Feed ends up being the slight winner when it comes to generating Page Likes.
Once again, we’ve been led to believe that running Page Like ads on mobile devices is extremely effective. It’s not as effective as desktop for me.
The bulk of my spend here has been going towards Desktop News Feed. I may cut off mobile entirely going forward.
What Are You Seeing?
Clearly, I’m seeing results (sales, registrations and Page Likes) from the sidebar, and at a greater rate overall than I am on either the desktop or mobile News Feeds. But this does not apply universally, and you should check your own stats.
Are you seeing similar results? Let me know in the comments below!


