Any screenshots and details of functionality may no longer be relevant. Below are some related posts that are more current:
- Meta Ads Attribution Reporting: What Your Results Really Mean (Jun 2, 2026)
- No-Cost, One-Click Conversions API Solution (Apr 19, 2026)
- How Meta Ads Attribution Works in 2026 (Mar 10, 2026)
I obsess over the ads that I run. I check them every morning, afternoon and night. And if you pay attention, you’ll spot some pretty darned interesting things.
The Example
I created a campaign that uses a Facebook video and a text call to action with a link to a product landing page. That landing page focuses on three different pricing options.
The Surface Stats
Here are the final six columns of stats for the ads of a campaign within Ads Manager.
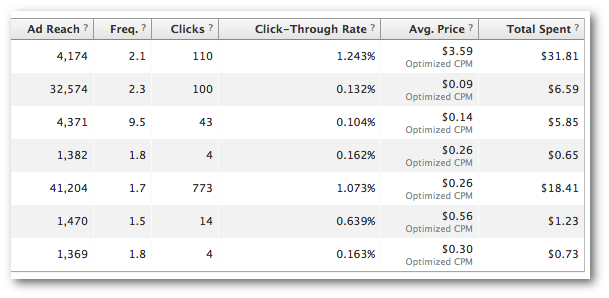
This shows the stats that the majority of marketers will focus on. So let’s break this down…
Clicks: You want clicks, so you’ll look at this. If this is how you measure success, here is how we break down the performance of these ads:
- Ad 5: 773
- Ad 1: 110
- Ad 2: 100
- Ad 3: 43
- Ad 6: 14
- Ad 4: 4
- Ad 7: 4
Of course, there’s no context to those clicks. But Ad 5 is pumping out a ton!
Click Through Rate: This will help us better understand the percentage of people clicking.
- Ad 1: 1.243%
- Ad 5: 1.073%
- Ad 6: .639%
- Ad 7: .163%
- Ad 4: .162%
- Ad 2: .132%
- Ad 3: .104%
Average CPM: Some marketers spend far too much time looking at this one. They think that a higher CPM means a waste of money. There’s quite a disparity here regarding average CPM (in reverse order from cheapest to most expensive):
- Ad 2: $.09
- Ad 3: $.14
- Ad 5: $.26
- Ad 4: $.26
- Ad 7: $.30
- Ad 6: $.56
- Ad 1: $3.59
Cost Per Click (Manually Determined): While Facebook doesn’t show this in all cases, a smart marketer will calculate it manually based on total spend over number of clicks. So let’s see how these ads stack up:
- Ad 5: $.02
- Ad 2: $.07
- Ad 6: $.09
- Ad 3: $.14
- Ad 4: $.16
- Ad 7: $.18
- Ad 1: $.29
The Assumptions
If I hadn’t used Conversion Tracking, I would assume that Ad 5 was phenomenal. In fact, there would be no reason to run any other ad. I was getting a ridiculous $.02 per click and that ad got me more than 7X the total clicks of any other ad.
Ad 1, while it got me the second most clicks, also was easily the most expensive per click. It’s also the ad that was eating up most of my budget (nearly half). Some evidence here to stop Ad 1 based on surface stats.
Otherwise, Ad 2 is the one ad I may consider keeping alive. It brought me a $.07 CPC while netting 100 total clicks.
These are assumptions. But when you assume…
The Conversions
I actually did use Conversion Tracking for these ads. In fact, it was set up so that Conversion Value is returned based on any of the three packages a customer may have purchased.
Value of those packages: $19, $29 or $79.
So here are the results when we include Conversions and Conversion Value:
- Ad 1: 13 Conversions, $287 Conversion Value ($31.81 Spend)
- Ad 2: 0 Conversions, $0 Conversion Value ($6.59 Spend)
- Ad 3: 2 Conversions, $48 Conversion Value ($5.85 Spend)
- Ad 4: 0 Conversions, $0 Conversion Value ($.65 Spend)
- Ad 5: 0 Conversions, $0 Conversion Value ($18.41 Spend)
- Ad 6: 0 Conversions, $0 Conversion Value ($1.23 Spend)
- Ad 7: 0 Conversions, $0 Conversion Value ($.73 Spend)
Let’s backtrack…
We had assumed that the top performing ad would be Ad 5 based on a ridiculous $.02 CPC. It also led to 773 clicks, so we thought this would lead to a bunch of conversions. Ad 2 was the other ad we’d consider keeping alive.
Meanwhile, it looked like Ad 1 was a complete waste of money.
But…
Ad 1 was the ad that brought the most conversions and value. Easily. We’re talking a 9X ROI on that ad. Ad 3, another ad we would have stopped, was bringing a 8X ROI.
The ads we thought were performing? No ROI. Nothing. Potentially throwing money away, though an argument can be made for small sample size for Ad 2.
Use Conversion Tracking!
What did we learn here?
We learned that it’s very easy to get distracted by the wrong stats.
We learned that a high Optimized CPM may just be a sign that the ad is highly optimized (which is what it’s supposed to be!).
We learned that if you don’t use Conversion Tracking, you’re going to have a hard time determining which ad is actually leading to revenue. As a result, it’s very easy to make the wrong decisions when managing your ads.
So use Conversion Tracking! It’s really not that hard to do. Go here to learn more about how you can set up Conversion Tracking on your site and for your ads.


