If you’ve noticed a drop in performance for a Facebook ad set, it may be due to audience saturation. But, how can you know for sure?
Luckily, there’s a way. And it’s clear that most advertisers don’t realize that it exists.
Let’s take a closer look at what audience saturation is, how you can detect it, and what you can do about it.
What is Audience Saturation?
You’ve saturated your audience when you’ve reached most of the people within a potential audience — or at least those who are most likely to convert. The audience has grown stale and those who see your ads every day have already seen them multiple times.
The potential impact of audience saturation is a drop in performance. Those who were most likely to act already did, and you aren’t reaching new people anymore.
The negative performance is directly measured by an increasing Cost Per Optimized Action (purchase, lead, etc.). But, how is Audience Saturation measured?
The Inspect Tool
If you aren’t yet using the Inspect Tool, it’s about time you start.
This tool is available for active ad sets using link clicks, conversions, leads, or app installs. Of course, that comes from old documentation prior to objectives changing, but know that it’s not always available.
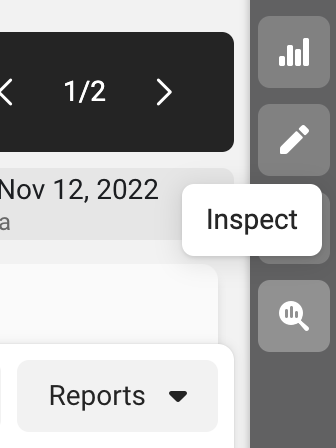
When you select a single ad set, click the Inspect icon (which looks like a magnifying glass) on the far right in Ads Manager.
Make sure you’re vieweing at least seven days of active data. There are several categories of helpful charts and graphs here (you may not get info for all of them):
- Bid Strategy
- Auction Competition
- Audience Saturation
- Auction Overlap
- Significant Edit History
This is all great stuff that you should dig into. But, of course, we’re here to focus on Audience Saturation.
The Charts
Here’s what you’ll see…
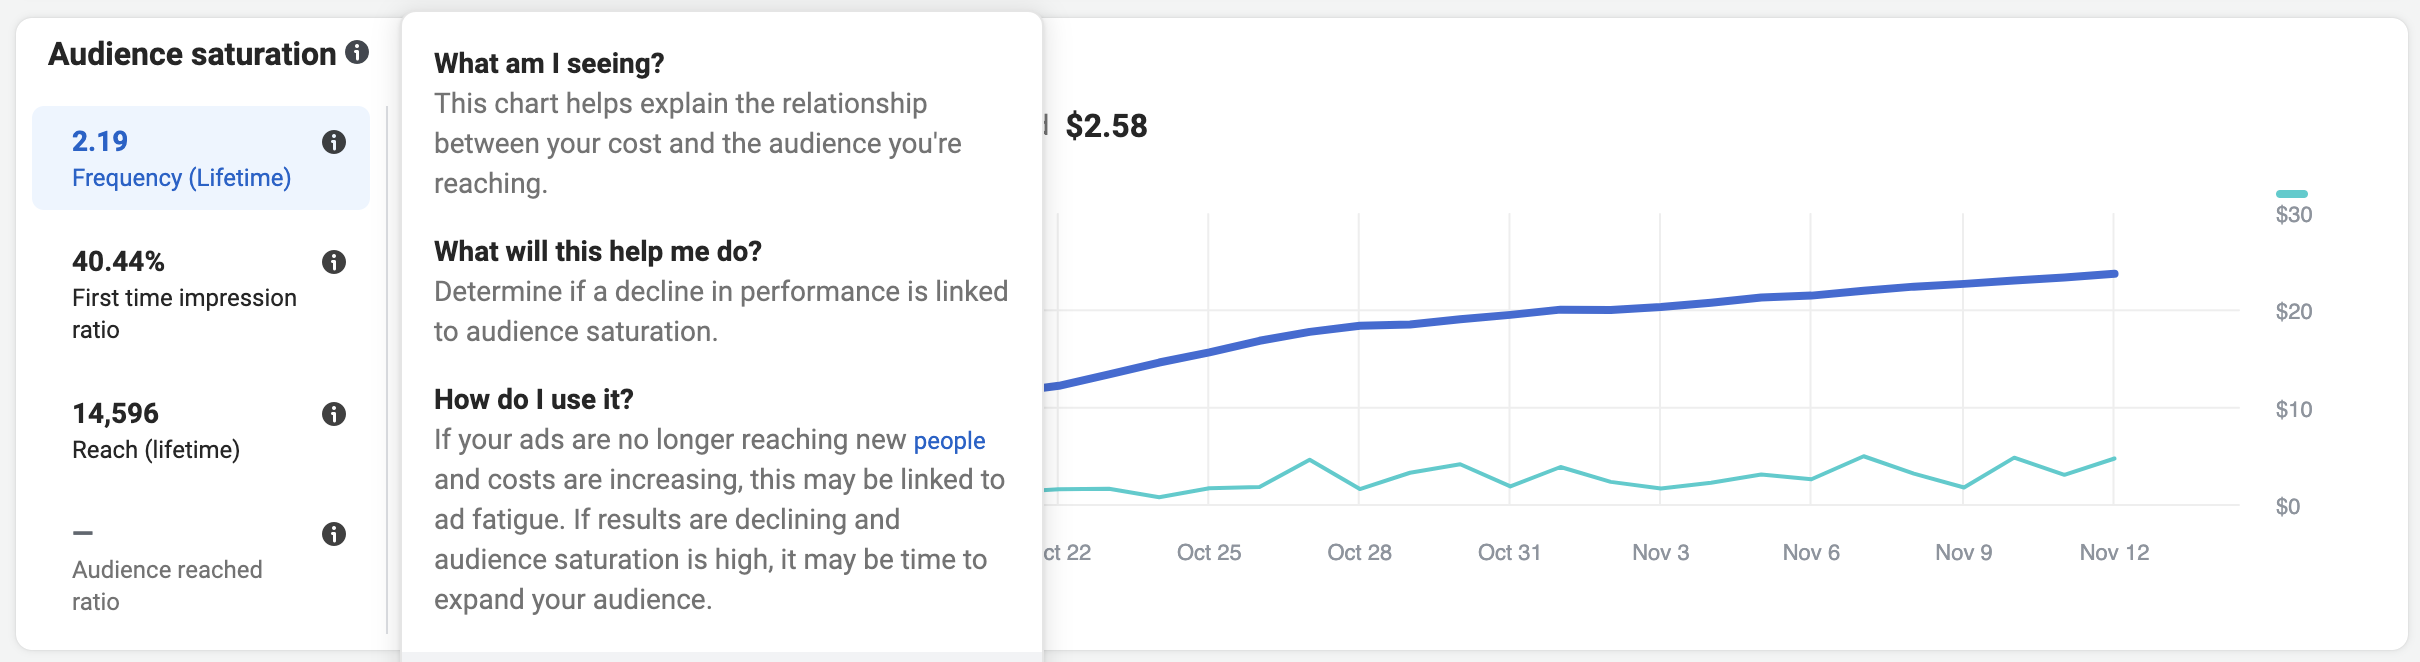
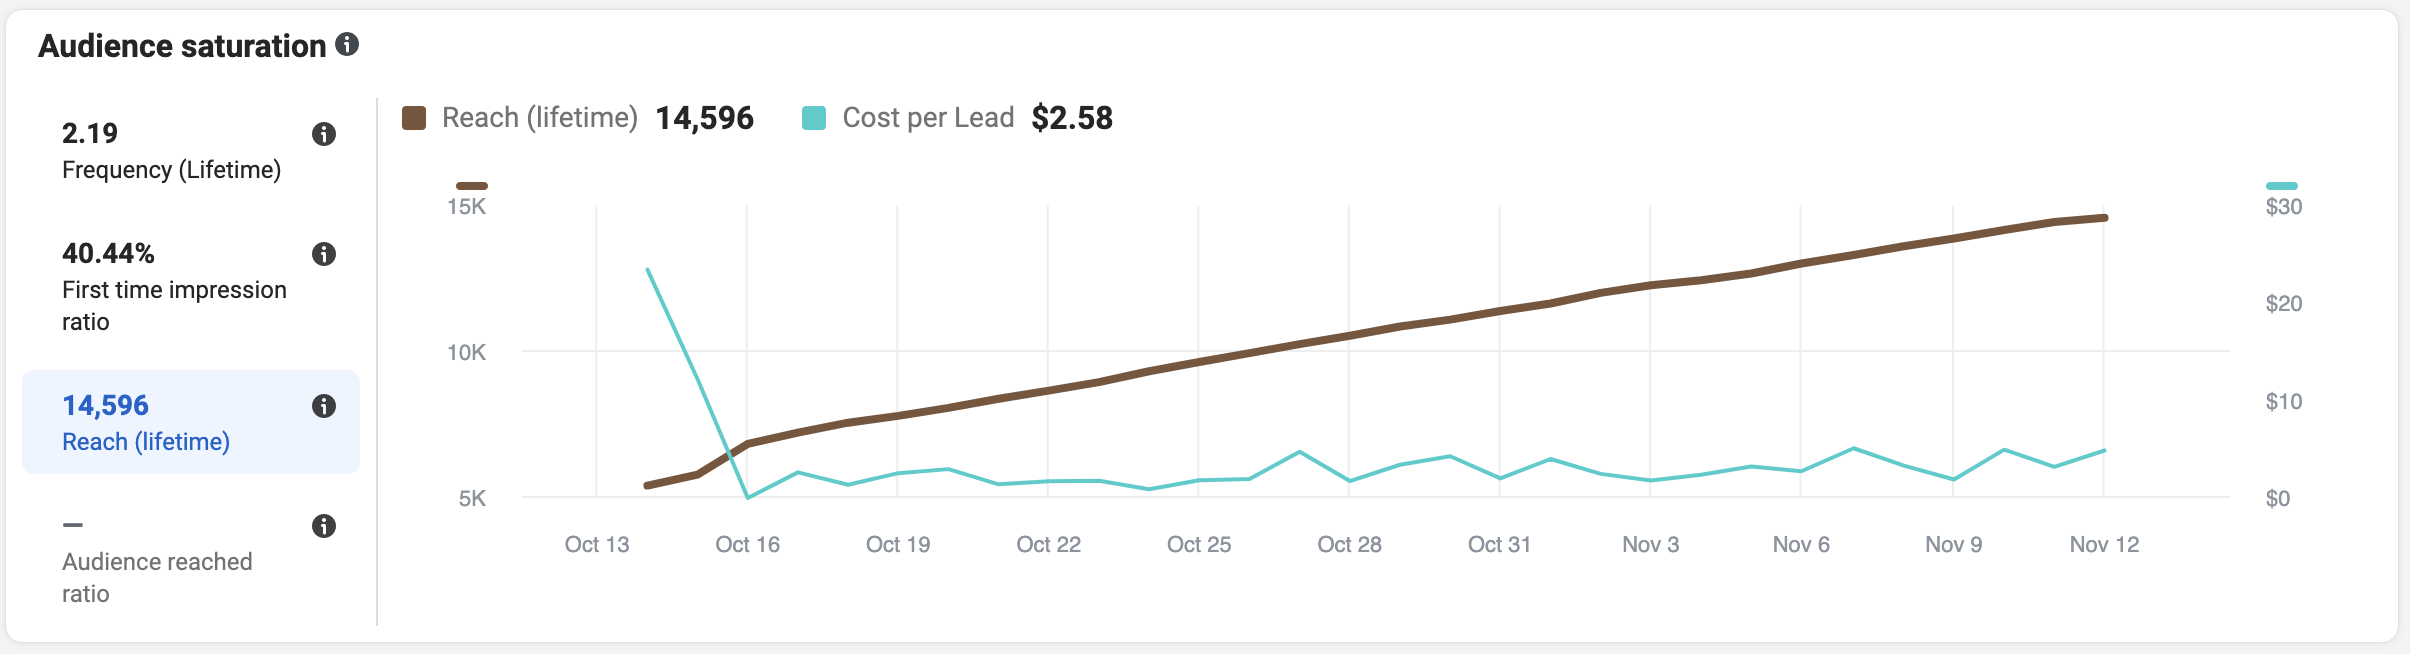
There are four charts. The first is Frequency. This is the number of times you’ve reached each person in the audience, on average, measured over time.
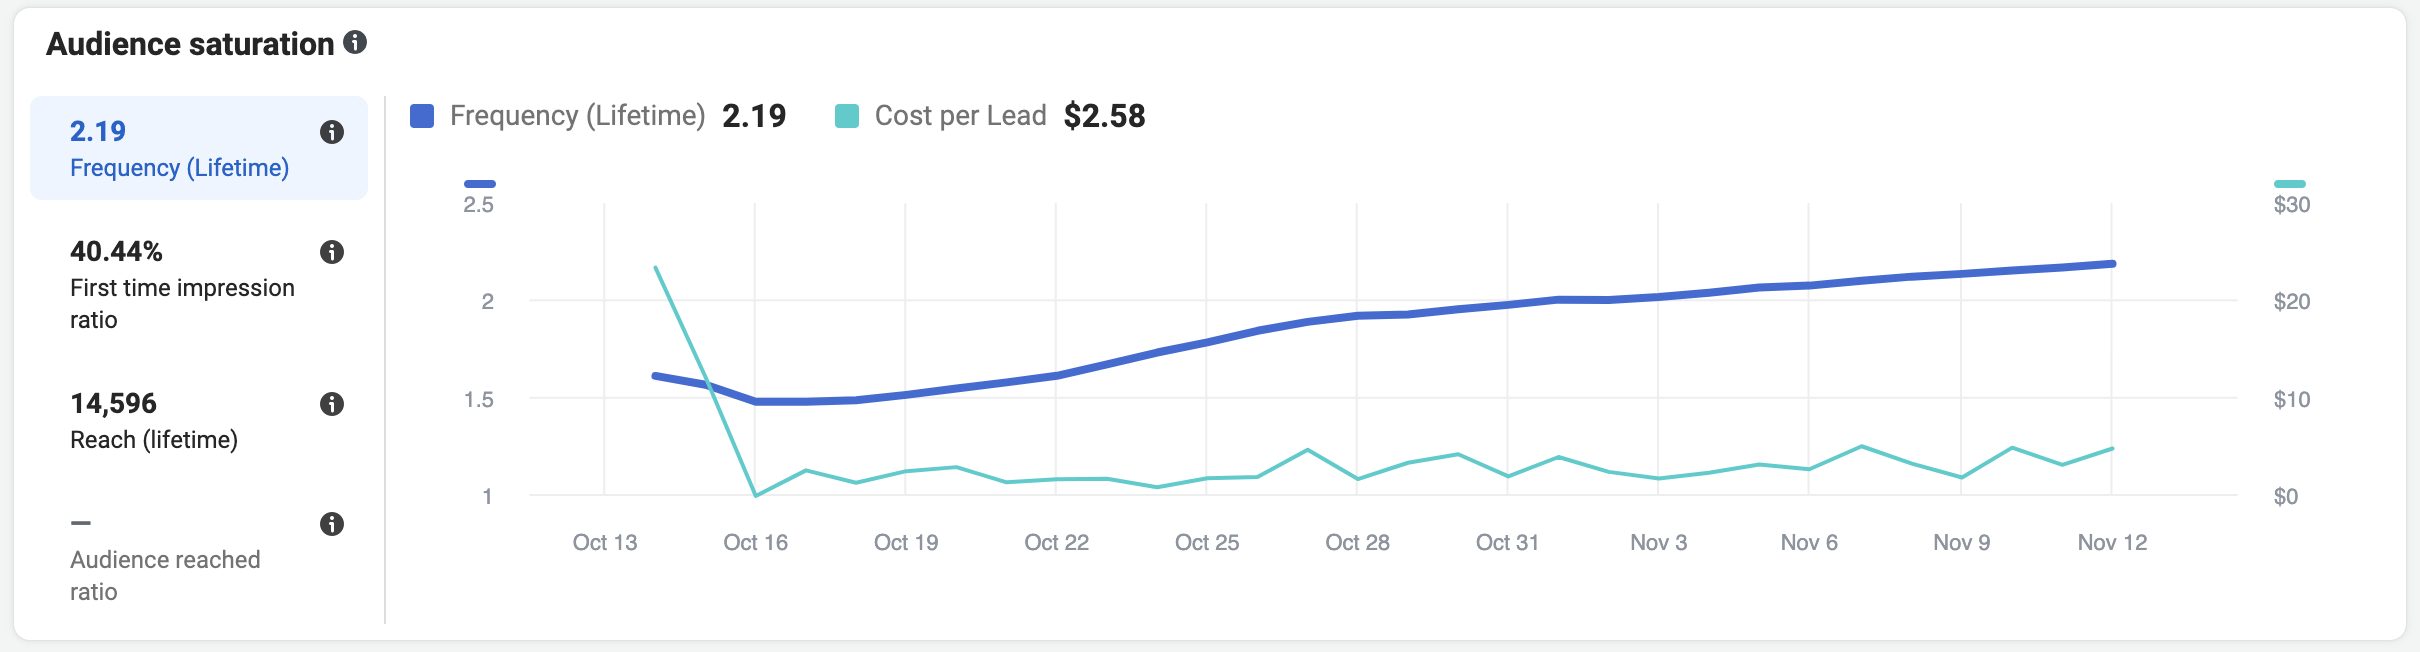
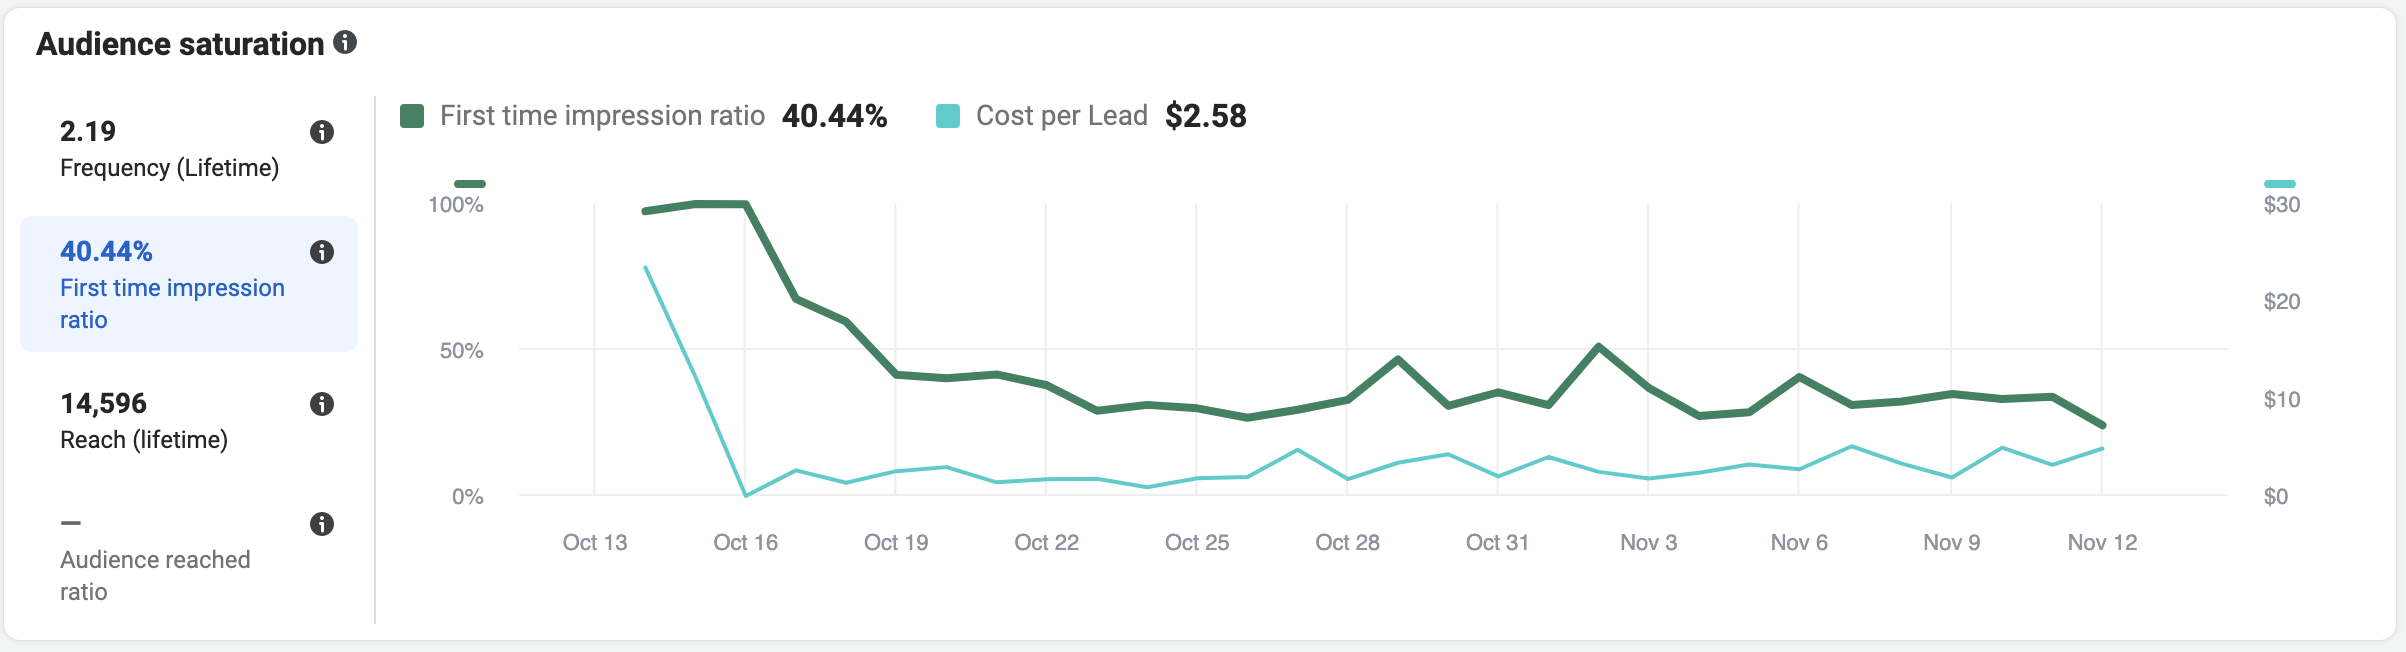
Next is First Time Impression Ratio. This tells you the percentage of daily impressions are the first time you’ve reached someone.
Next is Reach. Note that this is a unique number that only increases as you reach more people. For example, if you reached 10,000 people yesterday and those same 10,000 people today, your Reach does not increase.
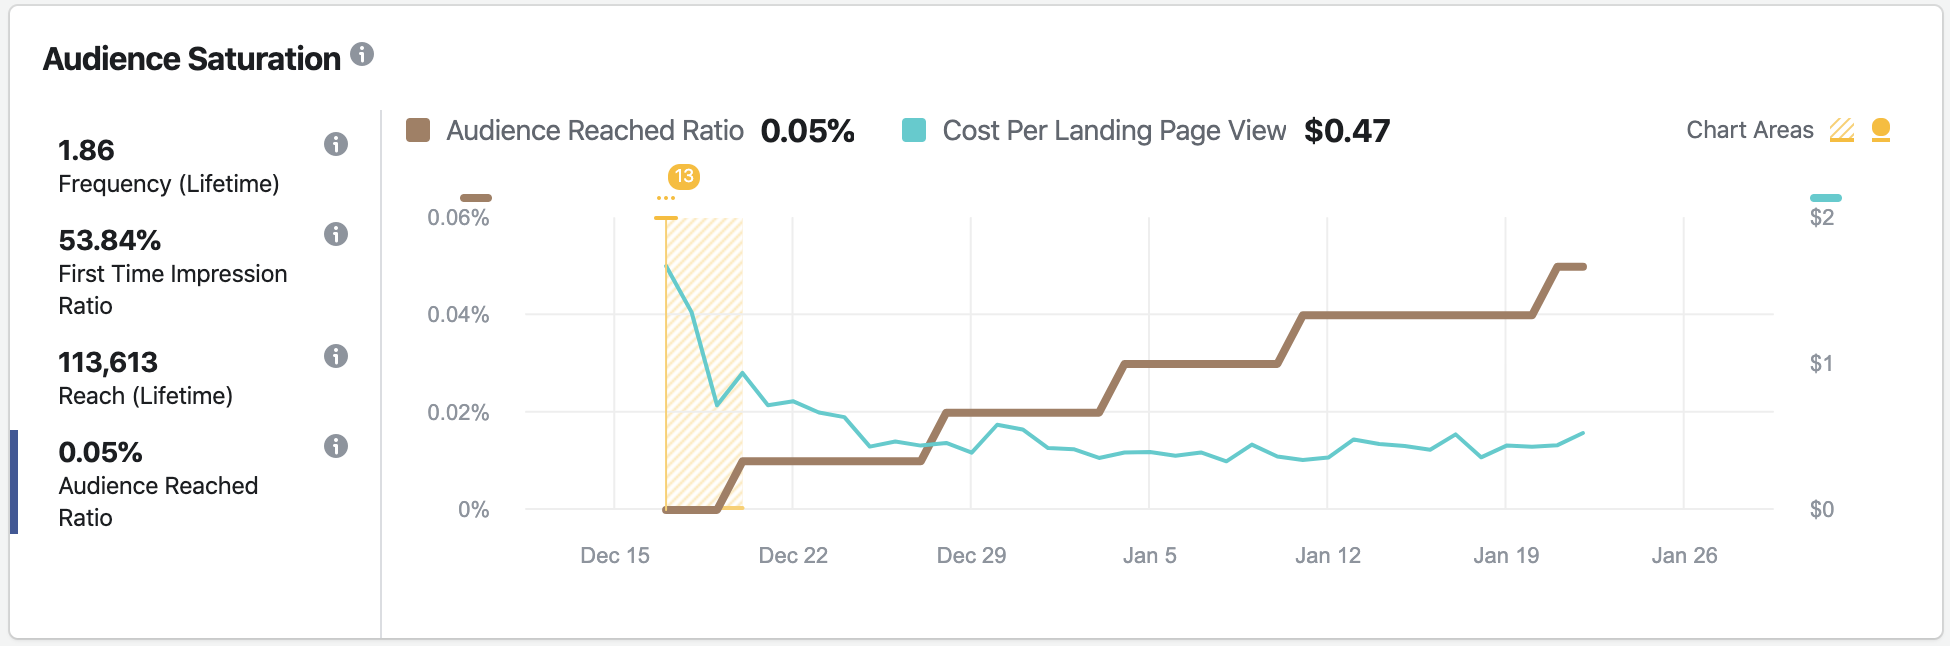
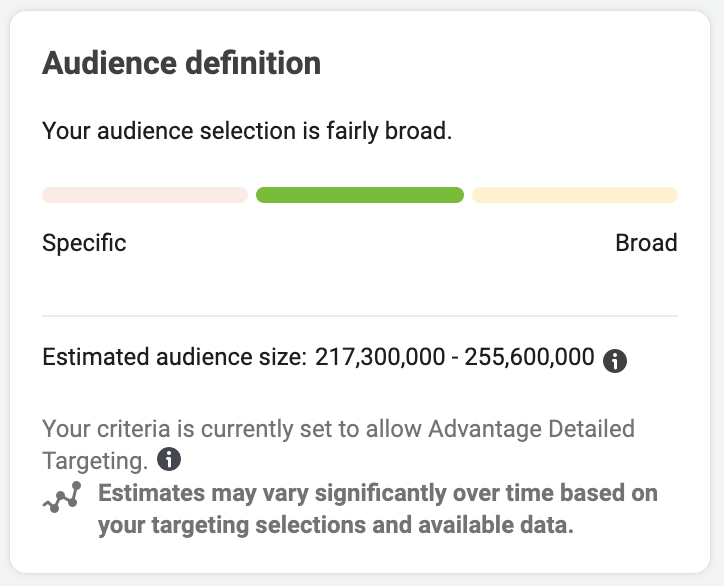
And finally, Audience Reached Ratio. This shows you the percentage of your total potential audience that you’ve reached.
The potential audience size is displayed in the ad set while you’re creating it.
All four of these charts help you determine whether Audience Saturation is leading to poor performance. See if Frequency or Audience Reached Ratio are increasing, Reach is flatting out, or First Time Impression Ratio is dropping and if those changes coincide with an increase in Cost Per Optimized Action.
Now What?
If you’ve determined that your audience is saturated, what do you do next? Well, first you should ask whether that Cost Per Optimized Action is still acceptable. If not, it’s time to do something about it.
Duplicate and create a new ad set. You’ll need to increase the audience size or target a different audience entirely. There are always many options for increasing the audience size (countries, ages, Expansion, Lookalike percentage), or you could simply try new audiences entirely
Your Turn
Have you run into issues with Audience Saturation? How do you manage it?
Let me know in the comments below!


