[AUDIO VERSION: I also recorded an audio version of this blog post. Click below to listen. Let me know if this is something you find helpful!]
You may be aware of a little Facebook ads experiment that I’m running right now. If not, go ahead and read this post (and maybe even become part of the experiment!).
The experiment is ongoing, and I’m going to save the bulk of my results until when it’s complete. But some things are so interesting, I just can’t help but write about it!
Based on the nature of my experiment, I’m able to learn some very interesting things about the decay of ads, activities and increase in costs over time.
Bottom line: If someone doesn’t act during the first two days of your ad, they become increasingly less likely to act as days pass.
Let’s take a look…
[Tweet “A Facebook ads CTR of 63% and a CPA of $.01? It’s happening. Take a look at this…”]
Experiment Refresher
I won’t completely rehash my experiment here (again, read this post), but it’s important to outline a few main points since they significantly impact my results — and allow me to learn things that won’t typically be seen.
1) I’m featuring a series of Facebook ads tips within ads. These tips are exclusive to those participating in the experiment and will only see this content via ads — or after someone engages with the ad. So far, there are eight total tips, and I’ve been promoting a new tip every few days since January 4.
2) You will only be targeted to see the newest tip if you read the preceding tip. Note that the only people seeing any of these ads will be very tightly targeted. They either opted in to see the ads in the beginning via a Website Custom AudienceThis is the group of people who can potentially see your ads. You help influence this by adjusting age, gender, location, detailed targeting (interests and behaviors), custom audiences, and more. More, or they see the latest tip because they read the last one (also via a WCA).
3) Once you read a tip, the ad will no longer be shown to you. This is again done via WCAs. This doesn’t prevent you from seeing the ad organically, of course (via comments, likes and shares), but this is a very big reason for a dramatic change in performance over time. As each day passes, the most engaged users are no longer targeted.
4) I’ve used both CPMCPM measures the cost per 1,000 impressions. It's a good metric to evaluate competition level and costs to reach your audience. More and now Daily Unique ReachDaily Unique Reach Facebook ads optimization allows you to limit the number of times you reach your audience to no more than once per day. More bidding. I’m not optimizing for an action because I want everyone who opted in to see the ads. I originally went with CPM, but frequencyCalculated as (Impressions/Reach), Frequency is a Facebook ads metric that measures the average number of times users have seen your ad. More became too high, and I was especially wasting money once the ads were running for several days. Beginning midday January 15, I began using Daily Unique ReachReach measures the number of Accounts Center Accounts (formerly users) that saw your ads at least once. You can have one account reached with multiple impressions. More across three ad setsAn ad set is a Facebook ads grouping where settings like targeting, scheduling, optimization, and placement are determined. More (one for each placementA placement is a location where your ad is shown. Examples include Facebook's mobile Feed, Messenger, Instagram feed, Audience Network, right-hand column, and more. More) for each tip. This assures frequency can’t be more than 3.0 overall for a single tip in a day.
5) Once it’s been 14 days since last participating in the experiment, I stop showing a user the ads. I use a 14-day duration for some of my Website Custom AudiencesA website custom audience matches people who visit your website with people on Facebook. You can then create ads to show to that audience. More to accomplish this. As you’ll see, I may want to limit this further (maybe seven days?). I want to leave some buffer, though, because it’s impossible to guarantee that I can show everyone the ads in a timely fashion.
Click-Through Rate Over Time
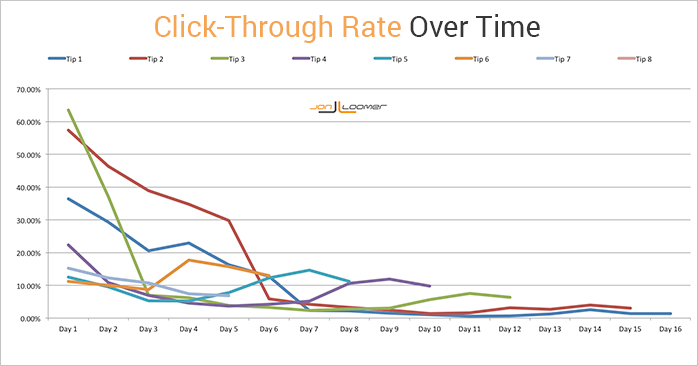
First of all, I’m not all that big on CTR. However, I feel this metric does a good job of at least showing the engagement level in these ads — and how that engagement changes over time.
Keep in mind that the only people seeing my ads are those who want to see them. In order to see Tip #1, they must have clicked the ad that invites them to participate. In order to see Tip #2, they must click the ad for Tip #1 (or otherwise see the page for Tip #1).
As a result, these click-through rates are off the charts. Higher than anything I’ve ever seen before. Absolutely insane.
Let’s take a closer look by day (up to Day 5)…
Day 1
- Highest CTR: Tip 3 (63.55%)
- Lowest CTR: Tip 6 (11.25%)
- Median CTR: 28.37%
Day 2
- Highest: Tip 2 (46.31%)
- Lowest: Tip 5 (9.57%)
- Median: 12.21%
Day 3
- Highest: Tip 2 (38.83%)
- Lowest: Tip 5 (5.30%)
- Median: 8.66%
Day 4
- Highest: Tip 2 (34.74%)
- Lowest: Tip 4 (4.51%)
- Median: 7.45%
Day 5
- Highest: Tip 2 (29.75%)
- Lowest: Tip 4 (3.67%)
- Median: 7.82%
Here are a couple of notes…
1) The first tips tended to get a higher CTR on Day 1. The exception is Tip 8, but otherwise this is consistent. An explanation for this may be simple fatigue as the excitement wears off the longer participants are in the experiment. (This is what I want so that I can reward those who make it to the end!)
2) Even the first three tips died eventually. The third tip had a CTR of 63.55% on Day 1, but had fallen all the way to 6.91% by Day 3. Tip 2 survived longer, posting 29.75% on Day 5, but quickly dropped to 5.87% on Day 6.
3) Tips later in the experiment had lower initial CTRs, but they didn’t die as suddenly either. Interestingly, Tip 6 has remained steady from Days 1 through 6, keeping between a range of 8.66% (Day 3) and 17.69% (Day 4).
4) The lowest CTR recorded is 0.58% (Day 11 for Tip 1). This is insane how much it dropped over time. Part of this is that those who were interested were quickly separated from those who weren’t. Excitement was high during the first few days.
Cost Per Website Click Over Time
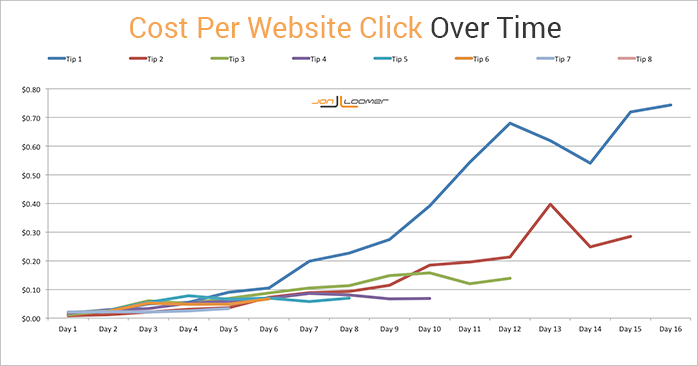
My main goal of this experiment was to drive traffic. Of course, the cost of driving that traffic will depend on several factors. I’ve seen CPMs as high as $9.49 for a given day and as low as $1.83. That, combined with the rate of getting those clicks, will cause a wide variation in costs.
But as you can see above, there is definitely a theme here: Costs are at their lowest during the first two days. After that, it gets increasingly more costly.
Let’s take a closer look by day (up to Day 5)…
Day 1
- Lowest Cost Per Website Click: Tie – 4 Tips ($.01)
- Highest Cost Per Website Click: Tie – 4 Tips ($.02)
- Median Cost Per Website Click: $.01
Day 2
- Lowest: Tip 2 ($.01)
- Highest: Tie – Tips 3 and 4 ($.03)
- Median: $.02
Day 3
- Lowest: Tie – Tips 2 and 7 ($.02)
- Highest: Tip 3 ($.06)
- Median: $.05
Day 4
- Lowest: Tie – Tips 2 and 7 ($.03)
- Highest: Tip 5 ($.08)
- Median: $.05
Day 5
- Lowest: Tip 7 ($.03)
- Highest: Tip 1 ($.09)
- Median: $.06
These are insane numbers for me. I’m used to getting a Cost Per Website Click in the area of $.15 to .20. On Day 1, I’m routinely getting either $.01 or $.02.
But notice the steep dropoff. Even following Days 1-5 doesn’t do this dropoff justice. Yes, the median rises from $.01 to $.06 in five days, but take a look at Tips 1 and 2 in particular.
By Day 7, I was paying $.20 for Tip 1. That’s now up to $.74 by Day 16. Again, remember that this was the first tip after the opt-in. It’s not a surprise that there are so many dead beats for this tip. That significantly decreases with each new tip.
On the flip side, look at Tip 4. That is consistency. While it was very average on Day 1 at $.02, it remains at $.07 on Day 10.
Contributing Factors and Considerations
A couple of very important factors to point out here.
First, these ads are launched in sequence. So when I launched Tip #1, the only competing ads had to do with inviting people to the experiment, welcoming them and allowing for the opt-out.
Tip #8 is running at the same time as the ads for all of the other tips. While someone won’t be served Tip #8 at the same time as Tip #7, they may be served tips for multiple ads in the same day if they click often.
Also, keep in mind that I changed my bidding approach on January 15 to Daily Unique Reach. This seemed to have a very positive impact on CTR (you’ll see the up-tick for many of these tips at about the same spot). I was wasting money on showing the same people the ads multiple times in a day — this became particularly bad several days in.
Note that this improvement in CTR doesn’t appear to have a major impact on Cost Per Website Click. Part of this could be due to an increase in CPM while using Daily Unique Reach. But this could be contributing to the lower Day 1 CTR numbers, but overall steady results over time.
Finally, understand that this experiment is fluid. While Tip 1 may have been published on January 4th and promotion started that day, some people didn’t start participating until several days — or weeks — later. As such, these results aren’t completely pure. “Day 10” doesn’t represent promoting that tip to the same audience for the 10th day. Many of the most engaged have already seen it and are now excluded, but some new people are being continually added.
Lessons Learned
This underscores two main points for me…
1) If you make ads interesting — if people are looking forward to seeing them — the results can be incredible. CTRs of over 50% and Costs Per Website Click of around $.01 are unheard of — at least for me.
2) The people most likely to act will do so in the first two days. This may be the most important lesson of all. Watch costs closely because if you don’t take advantage in those first two days, it won’t get any easier.
Your Turn
I’m having a lot of fun running this experiment, and as you can see there is plenty to learn. I’m looking forward to sharing more in the future!
What do you think of these results? Anything surprise you?
Let me know in the comments below!