Any screenshots and details of functionality may no longer be relevant.
On February 22, Facebook announced that they discovered a bug that was impacting reporting of Reach in Facebook Insights.
This did not impact delivery but rather the Reach displayed to admins for the past several months, dating back as far as September of 2012.
Had the bug been resulting in an inflation of numbers, one can only assume that immediate backlash would have resulted with claims that Facebook was lying to increase the perception of performance.
Instead, the admission from Facebook merely supports what many of us have suspected for quite some time.
So now that Reach numbers are actually better than we thought, what’s the reaction?
Immediate backlash, of course, with marketers now claiming that Facebook intentionally deflated the numbers to “force” brands to promote posts and reach more of their Fans.
If you’ve been listening to me since late August, you are unfazed by this announcement. Educated marketers put little stock in the Reach metric and do not allow it to drive their advertising strategy.
Unfortunately, there are many marketers who continue to focus on the wrong numbers. They spend energy in the wrong places. As a result, they are flashing their fists in anger.
Since the corrections to Insights are only starting to come out and they won’t be applied retroactively, it’s far too soon to respond to the impact to reporting. But it’s irrelevant.
The purpose of this post is to explain why Reach is an unimportant stat and also to show my data as an example of why you should focus instead on the metrics that matter.
Why Reach is Close to Worthless
Facebook Reach measures the number of users who may have seen your content because it was displayed to them during a designated period of time.
It’s not the number of people who saw your content. It’s not the number of people who engaged with your content. It’s the number of people who could have seen it if they were focused on a specific part of the page at a specific time.
Measuring Reach is an inexact science. It can’t be proven. You have to take Facebook’s word for it. As a result, I refer to Reach as the “imaginary stat.”
Before Reach was displayed prominently to admins, everyone was happy. It wasn’t until Facebook started putting this metric directly on posts and when it was announced that the typical brand reached “only” 16% of their Fans with a given post that people freaked.
Likewise, when Viral Reach plummeted during the end of August of 2012, people freaked. When Reach tanked in November as a result of an update to EdgeRank, people freaked again.
Facebook could make a new tweak to reporting and tell us that we now reach fans at an increased factor of five and everyone would be happy. All while the metrics that actually matter remain the same.
This is what bothers me most about each uproar over Reach. The fight is never over a resultant drop in Engagement (clicks, comments, likes and shares, for example). The focus is on a frivolous number that has no intrinsic value.
And this doesn’t even consider the fact that we have insanely unreasonable expectations about the number of Fans we should reach, considering that only half of Fans are online every day for an average of 30-60 minutes. Or that EdgeRank can actually benefit us by reaching Fans who weren’t otherwise online to see our content.
Whether there is a bug or not, Reach is a fuzzy metric that should never be the motivation behind your Facebook marketing strategy.
The focus of the rest of this post will be to present my data as evidence that there is little reason to care about Reach.
About the Data
First, it’s important to point out that using only my data (for Jon Loomer Digital on Facebook) doesn’t mean it applies to everyone. It’s a small sample size. But it’s a start.
To make sure that the information I present is as accurate and uniform as possible, I focused on the following:
- Links, Photos and Status Updates only since they represent the highest percentage of my content
- Removed any content from the analysis that received promotion
- Removed any content that was targeted by region or language
- Used all full months beginning in May of 2012 since April 26 marked the start of Fan-specific reporting
- Used medians for comparing stats so as to limit the potential for skewed data
Here is what’s left…
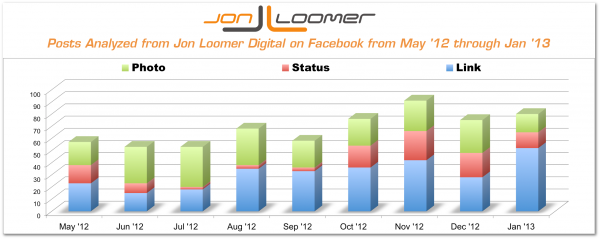
So, we’re looking at a sample size of at least 53 posts every month with a concentration first on links, then photos and finally status updates. You’ll notice a couple of shifts in this concentration as I experimented more with photos or status updates.
Note that since number of Fans increased from 2,848 to 8,939 during this period, it is necessary to compare data based on percentages of Fans rather than using totals.
Historic Reach of Jon Loomer Digital on Facebook
Now you understand what I’m working with. Let’s take a look first at how my Total Reach (both Fan and non-Fan) has fluctuated since May of 2012, by post type. Below is a chart that measures the percentage of Total Reach over Total Fans.
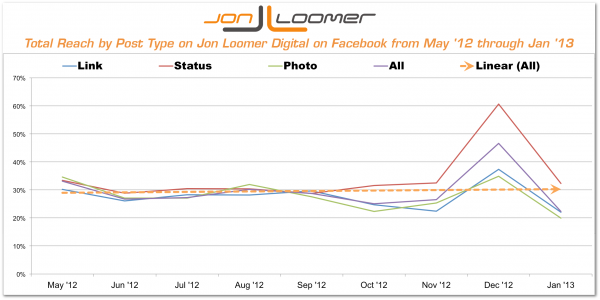
Note the orange dashed line is the trend.
It’s not all that easy to see the drop in Reach in this graph that was reported at the end of August and in November. Part of that is due to an unexplained (and temporary) spike that occurred in December that flattened the overall trend.
The drop is a little clearer when you break down the median Reach for all post types by month:
- May ’12: 33%
- June ’12: 27%
- July ’12: 27%
- August ’12: 30%
- September ’12: 29%
- October ’12: 25%
- November ’12: 27%
- December ’12: 47%
- January ’13: 22%
The three lowest Total Reach ratio months occurred in January ’13, October ’12 and November ’12 (percentage points less than June and July ’12). All of these lows occurred during the global drops that were reported by most admins.
You’ll also notice the spike in Reach from Status Updates beginning in October ’12 while Photos and Links dropped. This is consistent again with what was reported globally.
The drop is much, much clearer when viewing only percentage of Fans Reached.
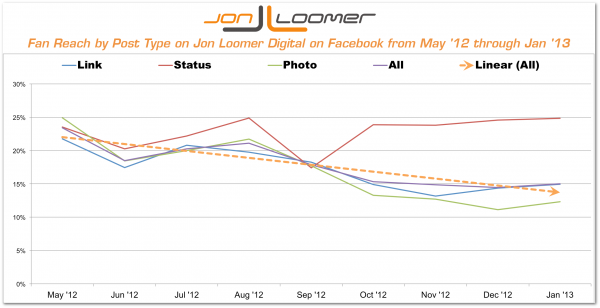
The drop in overall Reach of Fans is much more pronounced. Here are the numbers:
- May ’12: 23%
- June ’12: 18%
- July ’12: 20%
- August ’12: 21%
- September ’12: 18%
- October ’12: 15%
- November ’12: 15%
- December ’12: 14%
- January ’13: 15%
While I’ve always had good Reach with Status Updates, the difference became exaggerated beginning in October when Fan Reach of Photos was between 11-13% while Reach of Status Updates was 24-25% during the next four months.
This reflects everything that’s been reported globally. Fan Reach dropped mysteriously while the Reach of Status Updates became far greater than other post types around the same time (resulting in an overuse of this post type by marketers that continues to this day).
Here’s one final chart that shows Fan and Total Reach by month.
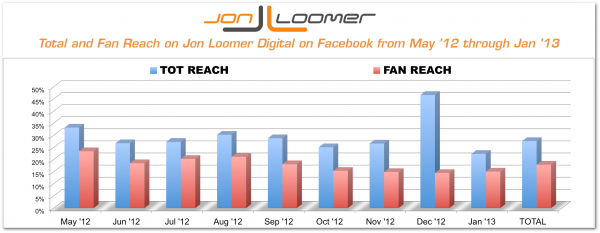
There’s that unexplained increase in Total Reach again, as well as the noticeable dip in Fan Reach while Total Reach remained more consistent.
Historic Engagement of Jon Loomer Digital on Facebook
If Reach means anything, a drop in Reach should result in a corresponding drop in important metrics like Engaged Users. As you will soon see, this was not the case for me.
The graphs mapping the percentages of Total Engaged Users and Engaged Fans look nearly identical, but with a positive trend over time.
First, the graph for Total Engaged Users over Total Fans…
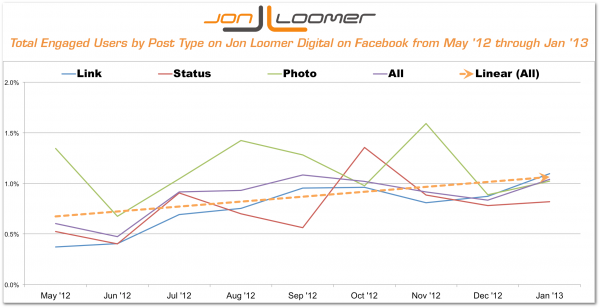
You’ll recall that Total Reach over Fans stayed relatively stable, but dropped some despite a mysterious spike. As you can see above, there were no such changes in Total Engaged Users since that rate remained on a steady upward slope.
It’s important to note that I’ve found the Engaged User Rates for Status Updates and Links to be about the same, both trailing Photos (and why you won’t see me obsessively forcing every post into a Status Update).
Now let’s take a look at percentage of Engaged Fans…
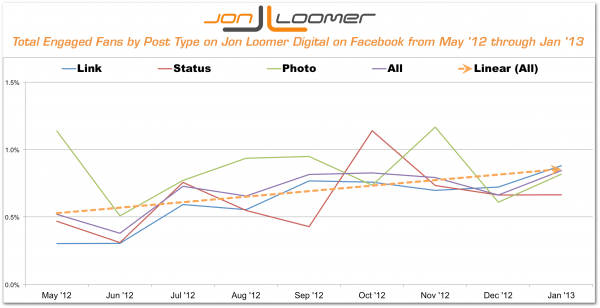
As you can see, this graph looks nearly identical to the one earlier for Total Engaged User Rate, with the difference being a slightly lower percentage (which makes sense, of course).
If you learn better by looking at numbers, here are the Engaged Fan Rates for all post types:
- May ’12: .52%
- June ’12: .38%
- July ’12: .73%
- August ’12: .65%
- September ’12: .82%
- October ’12: .83%
- November ’12: .79%
- December ’12: .66%
- January ’13: .84%
The highest Engaged Fan Rates occurred in October ’12, September ’12, November ’12 and January ’13, all months during or after globally reported drops in Reach.
What This All Means
This means that there is no direct correlation between a rise or fall in Reach and Engaged Users. It means that if your goal is to get users to click on your links and engage with your content, there is little reason to be concerned about marginal changes in Reach.
It also means that if you understand this, there’s little reason to protest any bugs or any changes in reporting regarding Reach. It’s a fuzzy, peripheral number that should not drive your marketing.
Reach is up. Reach is down. Reach is all around. But Reach doesn’t pay the bills.
The Forced Promoted Posts Argument
Okay, so now let’s get to the motivation behind this post: Backlash fueled by a belief that Facebook either intentionally pushed Reach down or ignored the bug to force or encourage admins to promote their posts.
This is utter and complete bunk.
Are you motivated to promote a post because the Reach is lower than you’d like? Because if you do, please stop.
When you measure the success of your Facebook marketing, do you create a report highlighting how many people you may have reached to make your point? Because if you do, please stop.
I won’t claim that no marketers do either of these two things. But bug or no bug, it’s a recipe for marketing failure.
The suggestion is that we should be furious that Facebook didn’t do a better job of correcting the bug associated with an inexact measurement; a measurement that can easily be reported differently — and truthfully — because it is inexact and can’t be proven.
Should you be angry that this flawed stat motivated you to waste money on Facebook ads? Sure, you should. You should be angry with yourself.
This leads me to one final point: The never ending conspiracy theories.
Look, I get it. You don’t trust Facebook. You think Facebook is out to screw you. And some may insist there is enough evidence to buy these fears.
I don’t buy them. It’s why I’m willing to invest my time and money into the Facebook platform. And frankly, I’m beyond the point of being tired of hearing the conspiracy theories.
But if you buy into the theories — if you don’t trust Facebook with your business — stop wasting your energy on it.
Your business is important to you. If you have convinced yourself that Facebook is out to screw that business, move on to another solution.
Reported Reach is About to Change… SO WHAT?
Here’s the bottom line: Over the coming days and weeks, you may notice your Reach increase a percentage point or more (or it may not if you’re spammy). Maybe it’ll go back to where it was prior to those first changes in September.
But it doesn’t matter.
Focus on metrics that matter. Worry about the number of people clicking on your links or commenting, liking or sharing your content. Stop obsessing over a fuzzy metric that represents what someone may have possibly seen.
How about you? Does this reporting bug matter to you? Let me know in the comments below!


