There’s one thing you can always count on with Facebook: new features.
Well, make that two things: new features PLUS an occasional sense of dread and insecurity in how to successfully use and implement them.
There’s always something new being rolled out, always something previously undiscovered, and always something that leaves us asking, “What the heck does this button do?”
With the incredible volume of new products and tools released every month, some folks might have missed the launch of Facebook Analytics. However, it’s a MUST LEARN for all Facebook/Instagram marketers big and small.
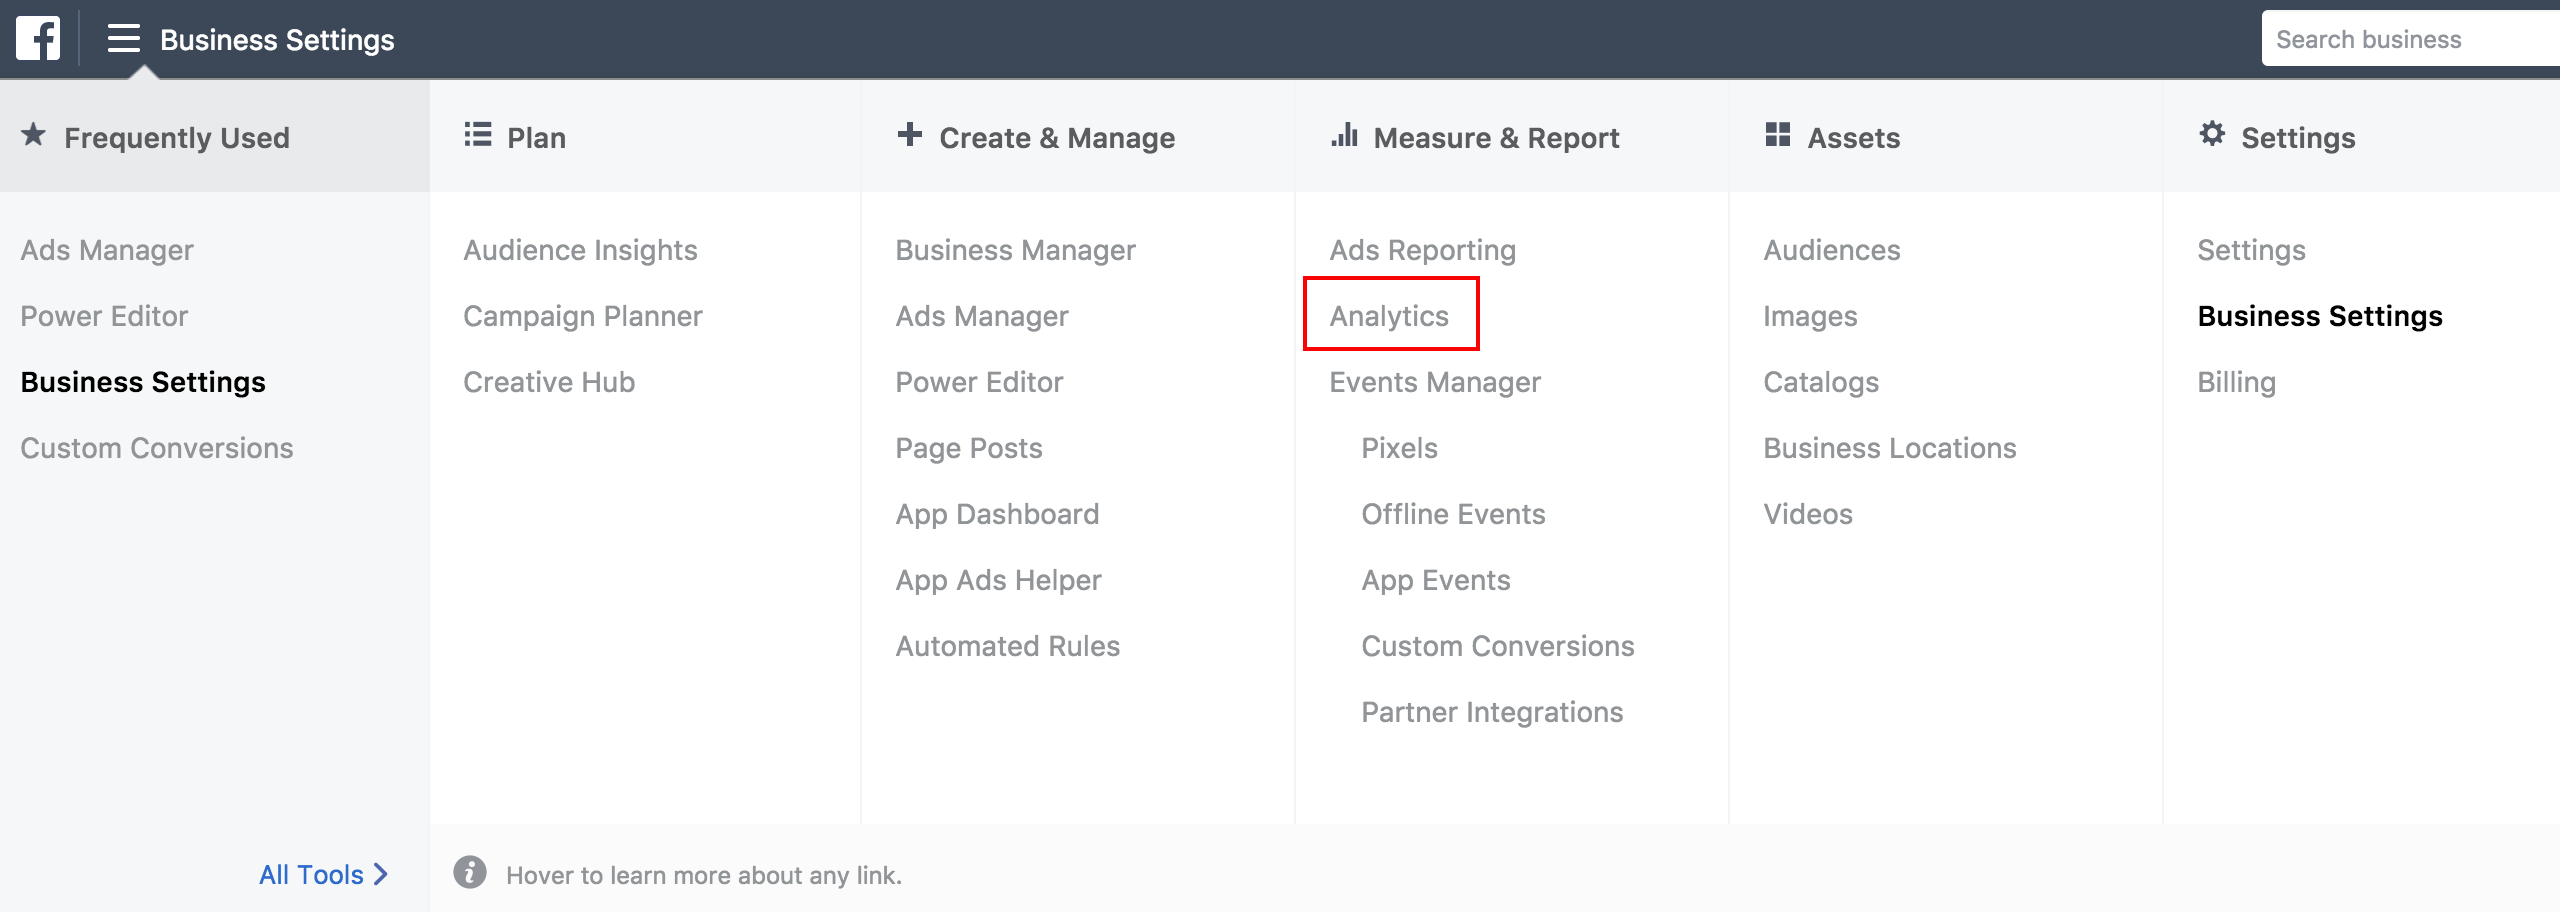
Facebook Analytics is a comprehensive tool that allows you to visualize your entire sales funnel, understand the lifetime value of users, and see how your organic and paid strategies intersect.
Even better, it’s a FREE tool that requires only your Facebook page and pixel, and it lives within your Facebook ad account!
Ask any Facebook advertiser or digital marketer what their challenges are and they’ll no doubt mention sales attribution as being one of their most stress-inducing conundrums.
Jon and I often receive questions and complaints from marketing executives at Fortune 100 companies expressing their confusion on how data from Facebook intertwines with Google Analytics and what else they can do to fully understand the complete story.
If you have the Facebook Pixel installed and customized, then you’re already past step one. The next step is to customize your Event Source Group, which we’ll talk about further below.
The final step depends on what you’d like to improve and understand better. Is your online purchase rate low? Are there pages on your website where users drop off more quickly than other pages? Is your check-out or cart process overly complicated? This list goes on and on.
Facebook pitches Analytics as an informative tool intended for advanced advertisers. However, it’s applicable and accessible to marketers big and small, as there are important lessons we can all take away from it.
If you’re advertising on Facebook, Analytics will illuminate loads of ads data. But the particularly helpful part about the Facebook Pixel is that everything is measured, regardless of advertising.
All that said, there are three main components of Facebook Analytics that you must fully understand before you go deep sea data-diving.
Let’s take a closer look…
1. Visualizing Your Entire Funnel
Up until this point, visualizing your entire sales funnel on Facebook had been incredibly difficult. Jon’s experiment successfully proved how you can use Facebook ads to bring people creatively through your sales funnel. However, you lacked some important funnel-related details.
Have you been able to fully visualize the exact number of people who commented on a specific Facebook post and then added an item to their checkout cart on your website several days later? Have you been able to see the number of users who downloaded your app, then viewed a page on your site, then bought something a few weeks later?
This complex data is possible with Facebook Analytics.
Many advertisers think of Facebook ads and websites as very different and distinct beasts. However, while sometimes problematic, their relationship is indeed symbiotic.
With Facebook Pixel events properly integrated, you can now visualize what happens with your Facebook funnel, including how it relates and integrates into your broader website funnel. The more customized pixel data you have, the better.
The main Facebook pixel events I’d recommend customizing on your site are the following:
- View content
- Add to cart
- Initiate Checkout
- Purchase
- Lead
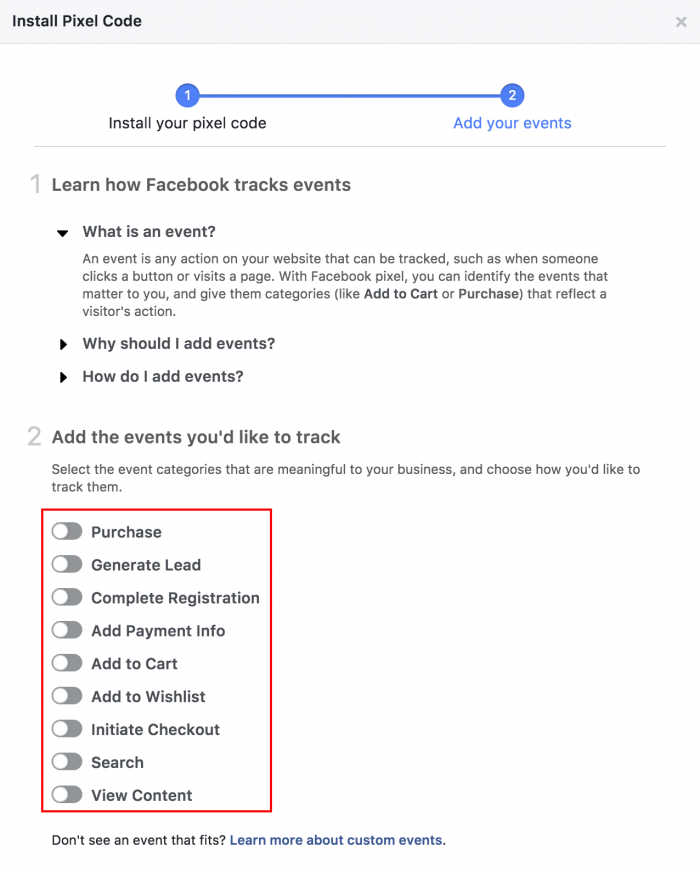
You can find the code for these within the Pixel Installation area in your ads account. With these events customized, you’ll begin to see clearer, more comprehensive data right away.
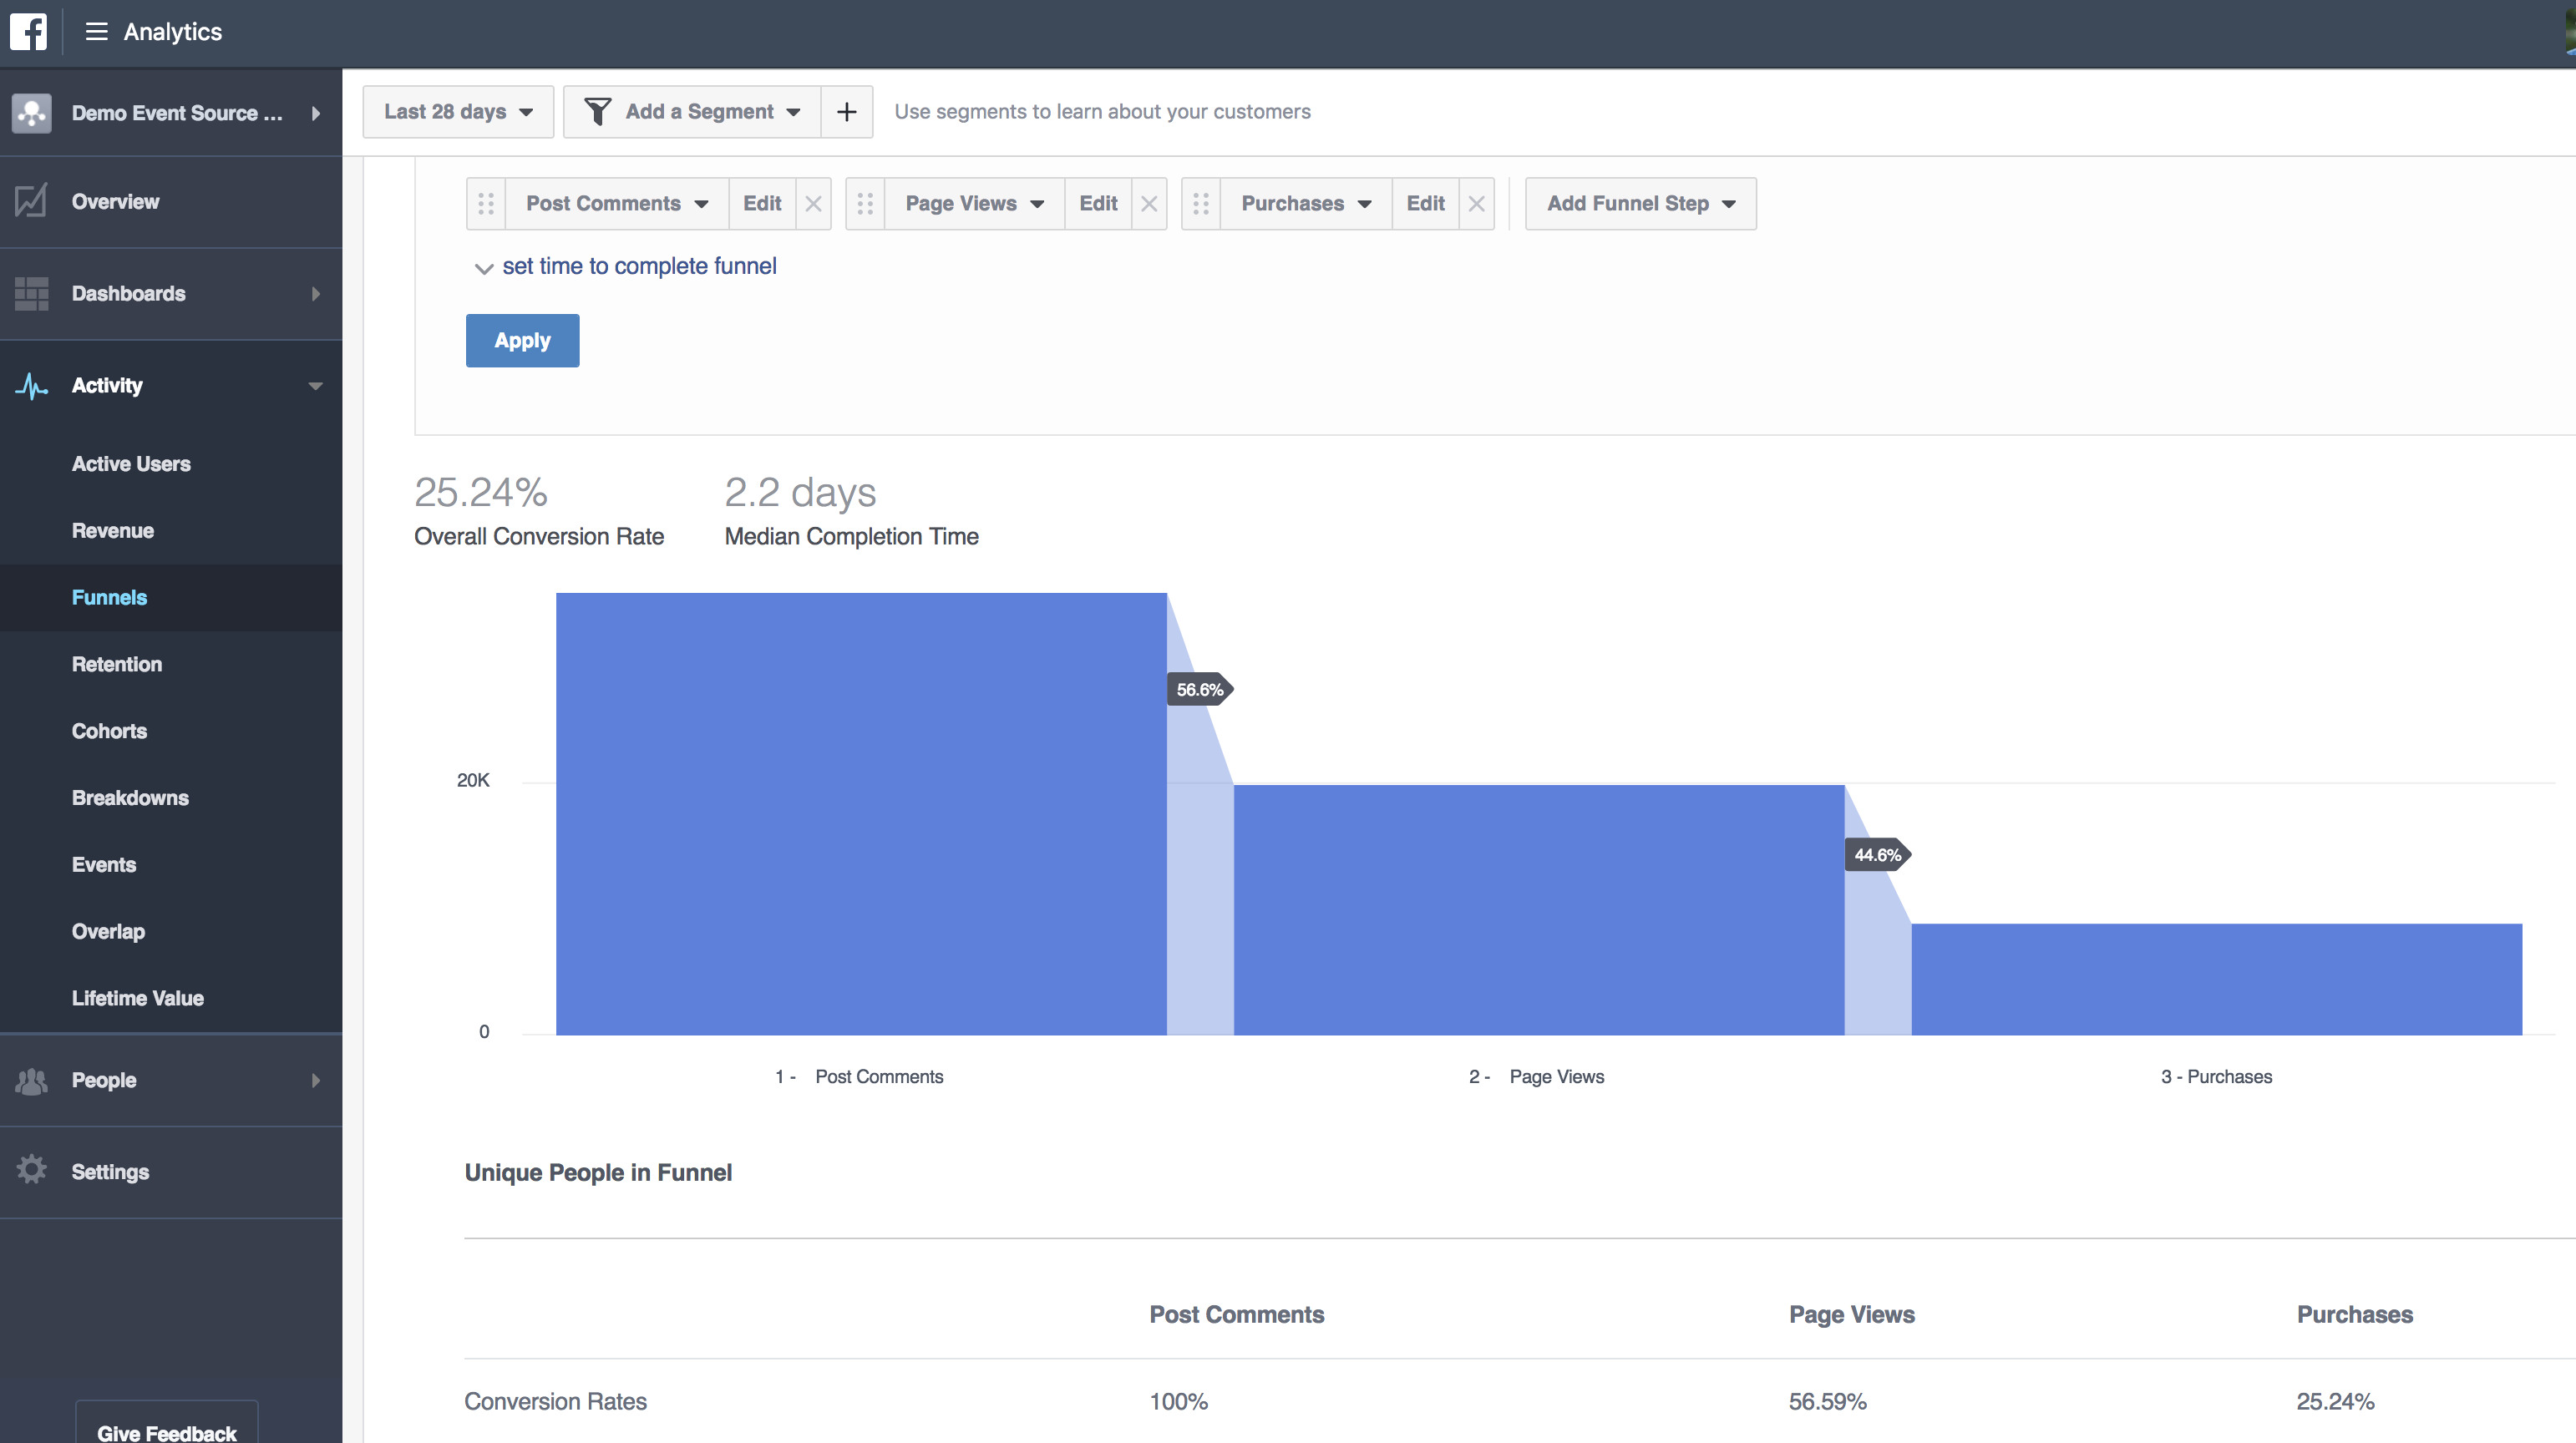
For example, see the funnel I built below, showing Page Views leading to post comments, all the way to purchases.
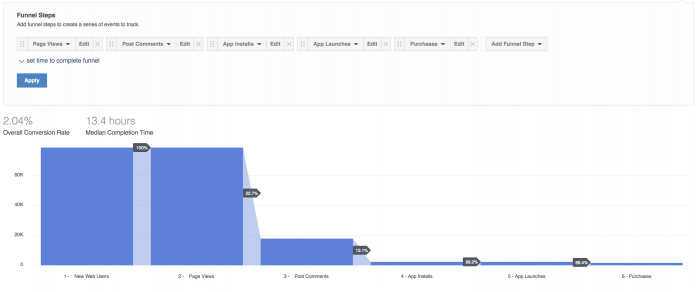
These are built within the “funnels” area of Facebook Analytics.
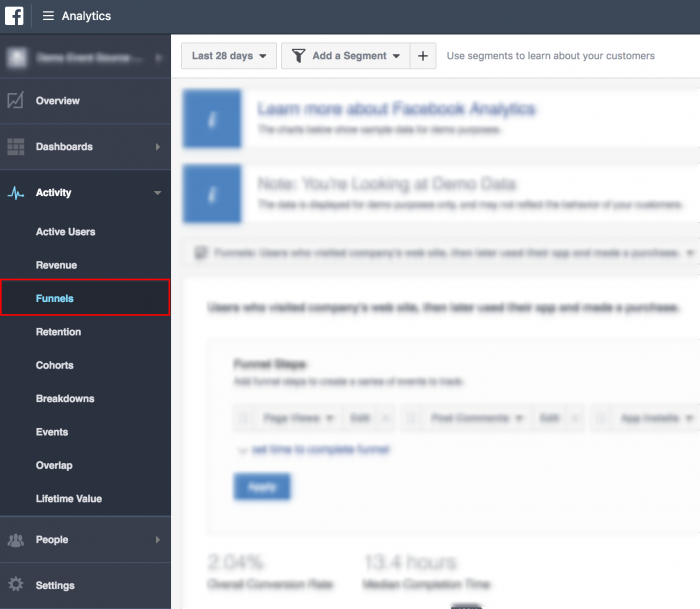
Thanks to this tool, we can visualize how many people commented on a blog post. Then, of those who commented, we see how many viewed a page on your website. And finally, of those people who commented and then viewed your website, how many purchased.

Consider these questions:
- Would a first-time site visitor sign up for your email list? Why or why not?
- Would they like the Facebook page first?
- Would they comment on a post first?
Once you start considering these stages, the funnels will illuminate themselves much more clearly.
2. Building Event Source Groups
Although “fractured data” sounds like a great 80s hair band, it’s actually a real problem for digital marketers these days. We have different sources telling us different things based on how different tools are measuring different data. It’s not a fun place to be.
One of the main culprits of this ongoing problem is that data isn’t housed in one place. We have Google Analytics telling us one thing and Facebook telling us another. We have pixel-based versus people-based tracking and marketing. All of these factors together create ongoing issues and tensions.
However, one key component where Facebook sets itself apart is the Facebook Pixel. There are many helpful benefits of the Facebook Pixel, but perhaps the most important one to advertisers is the ability to measure people-based actions because we are all logged into multiple devices on Facebook and Instagram. Extending this storyline even further is where Event Source Groups come into play.
In order to take advantage of Facebook Analytics’ richest features, you will need to connect multiple assets into an Event Source Group. An Event Source Group (ESG) is a tool within Facebook Business Manager accessible within the Business Manager Settings.
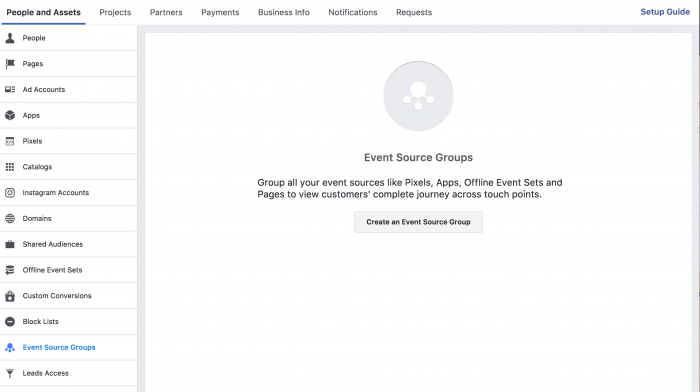
Once selected, it allows you to group together your Pixel, Page, Offline Event Set, or App for more complete data unification.
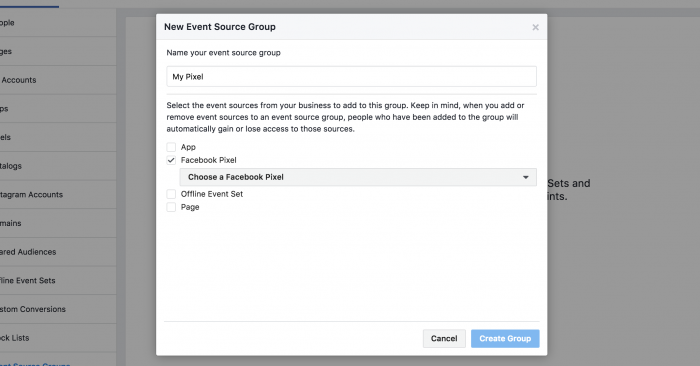
Once that is built, you can actually enter your ESG name into Analytics to begin building charts, graphs and whatever else you’d like to see.

With an ESG, you are finally connecting all the dots. Facebook likes to call this “omni-channel analytics” which helps to show a comprehensive view of the entire customer journey.
Even for the most complex businesses with multiple pages and multiple pixels where you’ll want to understand where overlap may occur, Analytics offers us the ability to bring multiple pages, pixels, and apps together.
3. Visual Aids to Illuminate and Illustrate Data
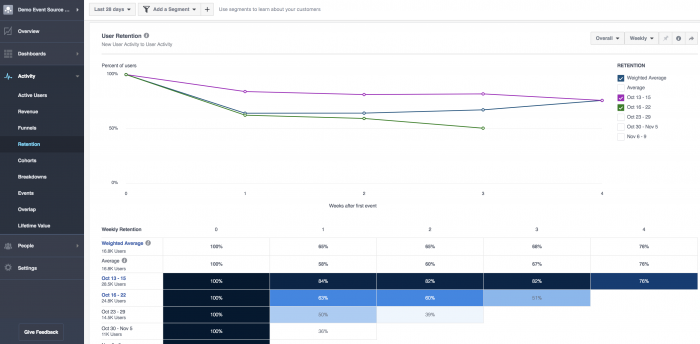
It’s an understatement to say the amount of data that you can visualize within Facebook Analytics is overwhelming. Facebook has given us an incredible amount of choice as it relates to how we want our data presented.
Do you like bar charts, graphs, or tables? Do you want to compare and contrast a specific segment of your users, or all your users? With Facebook Analytics, the choice is ultimately yours.
For example, here’s a look into a Lifetime Value Graph showing when the most valuable customers came in, along with what the value of a user looks like over time.
I actually just used this the other day to prove to a client their customer value increases after two months, because that’s when they really start to understand the power of the brand.
For every single data point you have, you can customize how you want it presented. Then, once you’ve decided on your visual aids, you can start to add them to your own Facebook Analytics dashboards.
The dashboards allow you to have dynamic, up-to-the-second data that you can share with clients, internal partners, team members, or just have on hand for your own research.
Your Turn
Those are just three of the fantastic NEW features of Facebook Analytics.

