Facebook announced several changes to Facebook ad metrics that will impact the results advertisers see and how they see them.
Let’s take a closer look…
Labels on Metrics
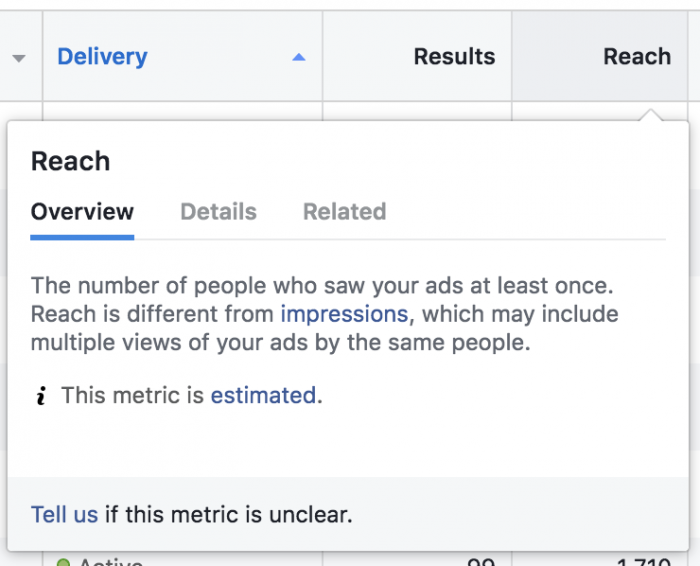
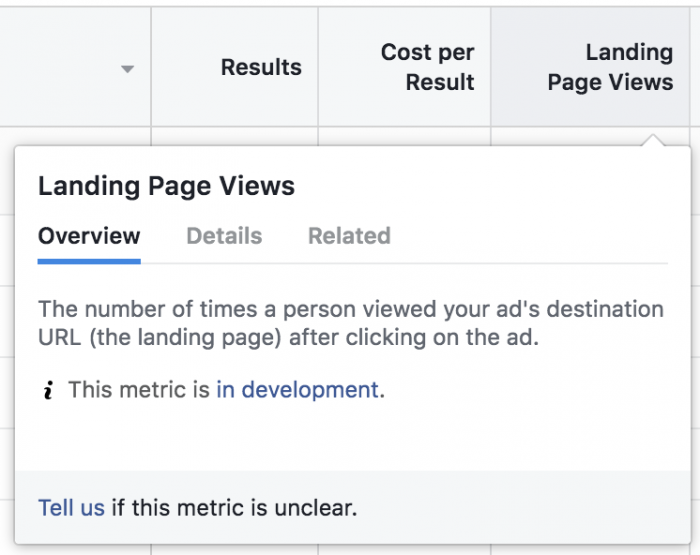
In an attempt that Facebook says improves transparency, certain metrics will be labeled as “estimated” or “in development.” You’ll find these labels within tooltips that provide more information.
ESTIMATED
Facebook says that estimated metrics are “calculated based on sampling or modeling,” and are therefore “hard to precisely quantify.”
Facebook uses Reach, the most famous (or infamous?) Facebook metric among marketers, as an example for explaining estimated calculations.
For example, reach is an estimate of the number of people who saw an ad at least once. In order for us to report reach, we analyze the number of people who see an ad multiple times, de-duplicate them and then calculate the total number of unique people in real time. To do this quickly, we sample the data and will therefore label it as estimated.
I’ve always considered Reach an inexact, low priority metric. This is the first time, however, I’ve seen Facebook describe it as being an estimate.

There is a LONG list of estimated metrics. See the entire list here. But following are a few highlights:
- Various mobile app actions
- Amount Spent
- Estimated Ad Recall Lift
- Frequency
- Negative Feedback
- People Taking Action
- Positive Feedback
- Reach
- Relevance Score
- Social Reach
- Store Visits
- Many of the “Unique” actions (clicks, CTR, Landing Page Views, Link Clicks, etc.)
To clarify: Being “estimated” doesn’t mean that a metric is wrong and can’t be trusted. Instead, I’d simply see these metrics as those that add to the story and provide context but are lower on the priority list.
IN DEVELOPMENT
There are also several newer metrics that Facebook says they are testing and are therefore labeled as “in development.” Since these metrics are new and in the process of being tested, they may still change.

Facebook uses Estimated Ad Recall Lift as an example:
For example, estimated ad recall lift is a metric used by brands to understand the differences between people who can recall a brand after seeing an ad compared to those who have not seen an ad. This kind of automated measurement is still new and requires both polling and machine learning. Because we use sampling to determine this metric, it will be labeled as estimated, and since we’re still gathering advertiser feedback on it, it will also be labeled as in development.
The metrics currently in development are as follows:
- Card Views
- Cost per Estimated Ad Recall Lift (People)
- Cost per Landing Page View
- Cost per Store Visit
- Cost per Unique Landing Page View
- Estimated Ad Recall Lift (People)
- Estimated Ad Recall Lift Rate
- Landing Page Views
- Store Visits
- Unique Attention Impressions
- Unique Attention Impressions Rate
- Unique Landing Page Views
Similar to the “estimated” metrics, understand that these metrics are being tested and may be imperfect.
Removing Metrics
In July, Facebook will be removing several metrics (19 by my count) that they feel are redundant, outdated, or rarely used. Interestingly, six of these metrics are those that were also labeled as “estimated.”
The following metrics are those Facebook plans to remove (metrics in bold are those that are also estimated):
- Actions
- People Taking Action
- Cost per Any Action
- Amount Spent Today
- Button Clicks
- Canvas Component Time Percentage
- Carousel Card breakdown for conversion metrics
- Link Click Destination
- Mobile App Actions Conversion Value
- Page Mentions
- Cost per Page Mention
- Page Tab Views
- Cost per Page Tab View
- Positive Feedback
- Negative Feedback
- Social Reach
- Social Impressions
- Social Clicks (All)
- Unique Social Clicks (All)
Facebook explains why they are removing each of these metrics and also provides recommendations for what you can use instead in this post. Following are the groups of metrics being removed and what Facebook recommends using instead…
Instead of Actions, People Taking Action, Cost per Any Action: Customize your own composite metric reflecting actions that are meaningful to your business.
Instead of Amount Spent Today: Select Today for the date range and use the Amount Spent metric.
Instead of Button Clicks: Link Clicks, Event Responses or Offers Saved.
Instead of Canvas Component Time Percentage: Canvas View Time and Canvas View Percentage.
Instead of Carousel Card breakdown for conversion metrics: Link Clicks metric broken down by Carousel Card and see conversion results without the Carousel Card breakdown.
Instead of Link Click Destination: Outbound Clicks and Landing Page Views.
Instead of Mobile App Actions Conversion Value: Specific app event conversion values (ex: Mobile App Purchases Conversion Value).
Instead of Page Mentions, Cost per Page Mention: Page Likes or Page Engagement.
Instead of Page Tab Views, Cost per Page Tab View: Page Likes or Page Engagement.
Instead of Positive Feedback, Negative Feedback: Relevance Score.
Instead of Social Reach, Social Impressions, Social Clicks (All), Unique Social Clicks (All): Reach and Impressions.
Your Turn
Do you see think these are positive changes? Any metrics that you don’t want to see go away?
Let me know in the comments below!


