Performance measurement of Facebook video ads is challenging, primarily due to the way video ads work. But, video breakdowns provide important context for the performance of these ads.
Let’s talk about the issues with video ads and how you can get a clearer idea of performance thanks to this buried feature.
The Problem with Video Ads
If you’ve run video ads on Facebook, you probably understand the concept of auto-play. When a video appears in someone’s feed, it may auto-play (assuming the person hasn’t turned this feature off or they don’t have slow internet).
This can be both good and bad, of course.
Auto-play can be good because a video playing in the news feed is more likely to get someone’s attention. Movement can be powerful.
It can be bad because it complicates measurement and reporting. You’re going to get a whole lot of plays of that video. In some cases, the user may have stopped to watch it. In others, they may not have even noticed that it was playing.
The issue of sound vs. no sound is also important. The video may be playing, but sound may be off. While captions may help, a play with sound on would certainly be preferred.
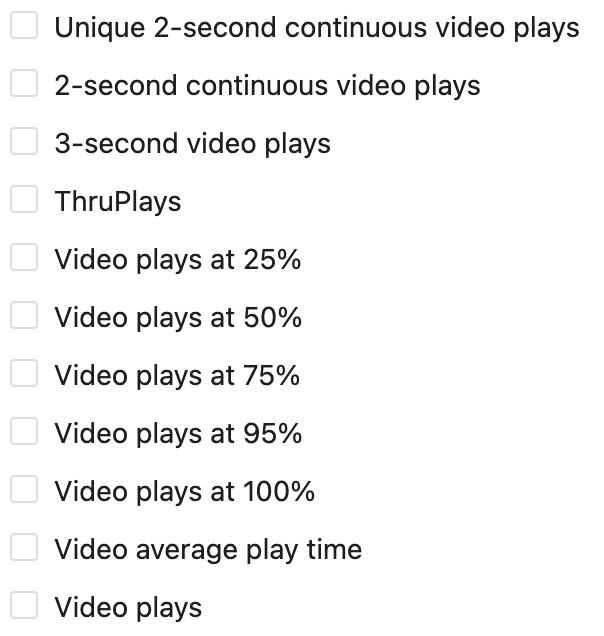
The video-specific metrics available to you in Ads Manager are okay. There are metrics for:
- 2-second continuous plays
- 3-second plays
- ThruPlays (15 seconds or the entire thing)
- 25%, 50%, 75%, 95%, 100%
- Average play time
- Total plays

These metrics by themselves aren’t great because they ignore important context. How many of these views are with sound off? How many were due to auto-play?
Breakdown by Action
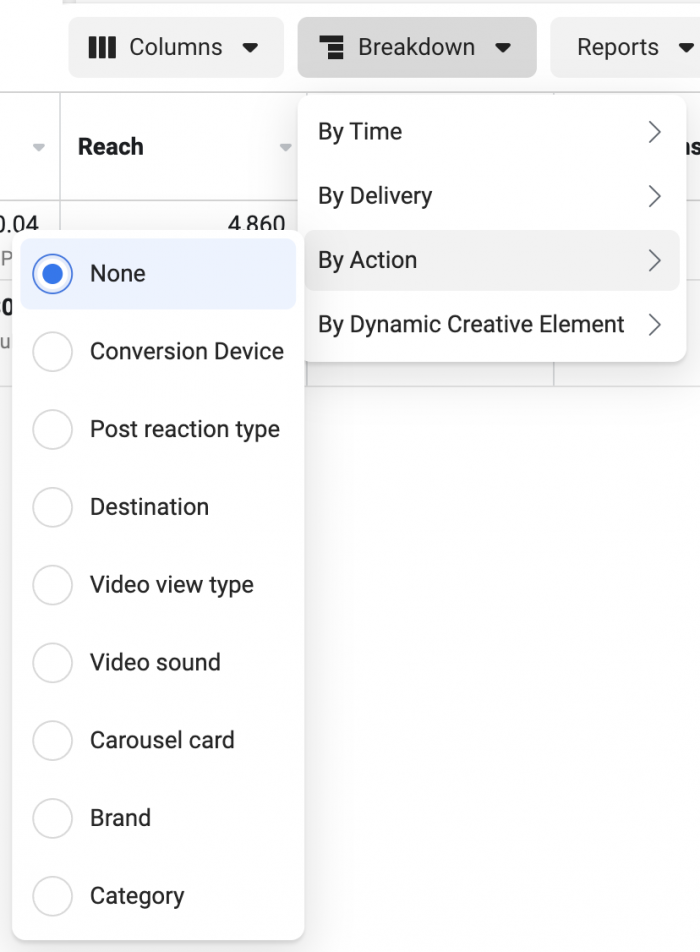
Luckily, there is a way to get this information. Within Ads Manager, use the Breakdown feature and select “Action.”

There, you should see two very relevant options:
- Video View Type
- Video Sound
1. Video View Type
When you breakdown by Video View Type, you can get separate rows of results for Auto-played and Clicked-to-Play.

In the example above, results fall heavily on auto-play. That certainly isn’t a great sign regarding the quality of engagement.
2. Video Sound
If you breakdown by Video Sound, you will be able to view different rows for Video Sound On and Video Sound Off.

In this case, the results are a bit more evenly split between the two, which is a better sign.
Taken together, these breakdowns will give you much better context for the metrics you are seeing. When you have better context, you can make more informed decisions with your advertising.
Your Turn
Have you used these breakdowns to better understand the performance of your video ads? What have you seen?
Let me know in the comments below!


