Any screenshots and details of functionality may no longer be relevant.
If you’ve been following along, by now you know that I put no stock in Facebook’s reported Reach metric. I call it “imaginary” because it can’t be proven and isn’t representative of substantive results.
Yet, during the past couple of months, it’s been the source of a major uproar. Everyone’s freaking out that a tweak to Facebook EdgeRank is resulting in a drop in Reach (engagement metrics be damned!).
So know that I really don’t care about this metric. But I realize that 99% of Facebook marketers do. So when I spotted a trend recently that Reach may actually be on the rise — not only for me, but in general — I was curious what types of responses it would generate.
Let’s take a look at what I’m seeing…
From the Timeline
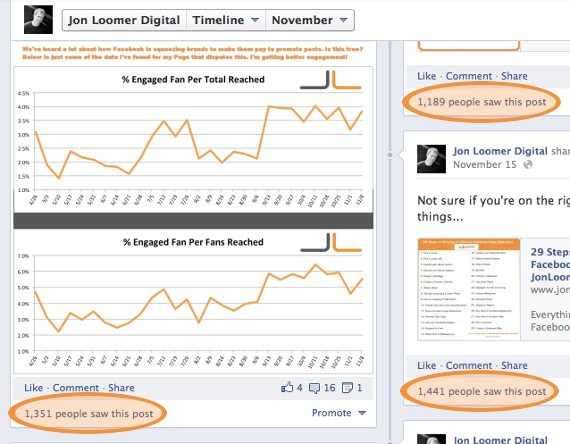
Reach is most visible to admins from a Page Timeline. It’s a metric that is impossible to ignore.
From September through much of November, my typical post without promotion would reach about 1,600 people. Sometimes more, sometimes less.
Here was a very common sight in mid-November:
So, needless to say I was a bit surprised when I started seeing this at the end of November and into December:
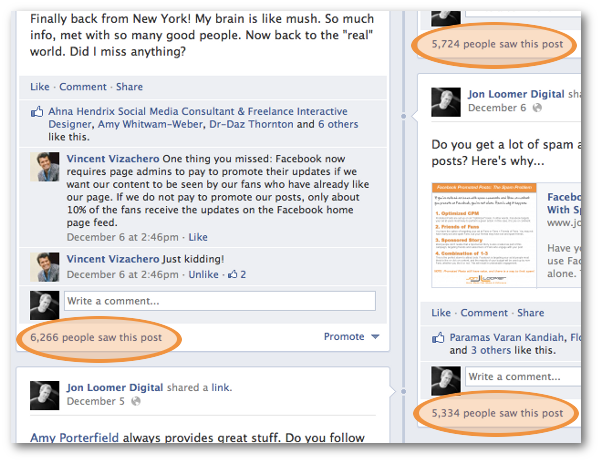
Getting a Reach of 4,000, 5,000 or even 6,000 was suddenly quite common — all without promotion.
From PageLever
First, I wanted to show you my data from my Insights Exports. Unfortunately, Exports have been absolute garbage for me lately. I get errors when I try to download them, and even when I do get them I’ll have missing data. While I did get data that supported what I was seeing within my Timeline, there was too much missing data to use it.
So my next step was PageLever.
I pulled Post Details data from September 1 through December 14. I exported into Excel and removed any post that was promoted and grouped data by week. I then found the median (rather than the average) so that my results wouldn’t be skewed by outliers.
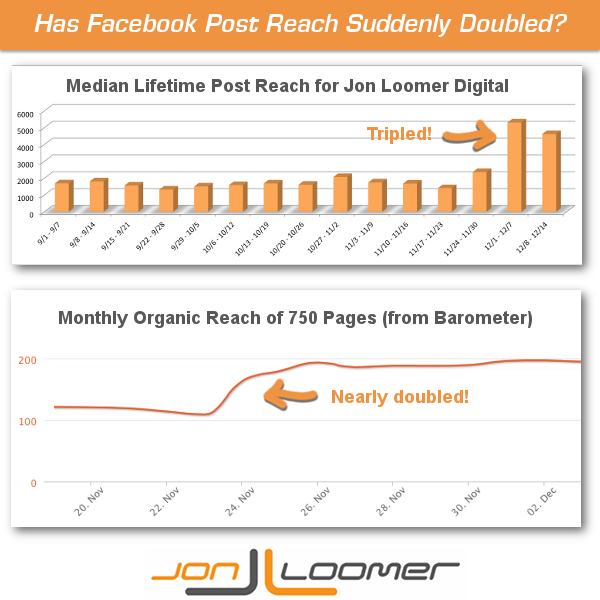
Here is my median Total Reach by week, starting September 1:
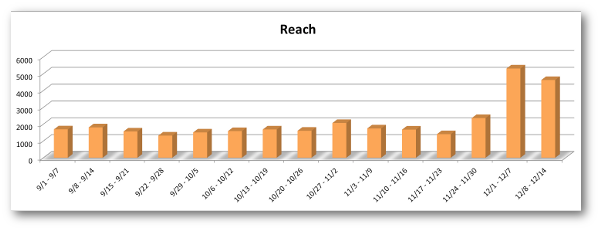
This supports everything I was finding within my Timeline. Up until the end of November, the weekly median Reach was always under 2,000 for posts that weren’t promoted. But for the first two weeks in December, the median Reach was 5,308 and 4,623.
My Reach rose more than three times from the middle of November.
Fan Growth
The first question someone may ask is whether my audience grew significantly during that time. It has not.
Here is my growth chart, thanks to PageLever:
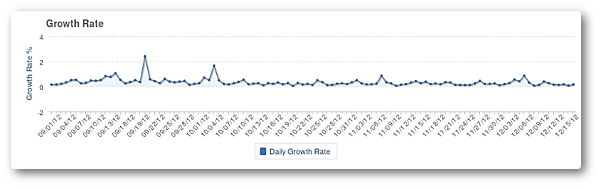
As you can see, nothing noticeable — particularly in November and December. And to more than triple Reach based on Fan growth, I’d need to see triple the Fans in a month. That obviously didn’t happen.
Engagement
So the next thought is this: SWEET! I must be getting some awesome engagement that is increasing Reach virally!
Nope. My engagement is actually a little pedestrian lately (can only blame myself). Here are charts for Stories, Engaged Users and Consumptions of my posts (here is an Insights Glossary, if you need it), all from PageLever. Exact same process of measurement as before, promotion removed.
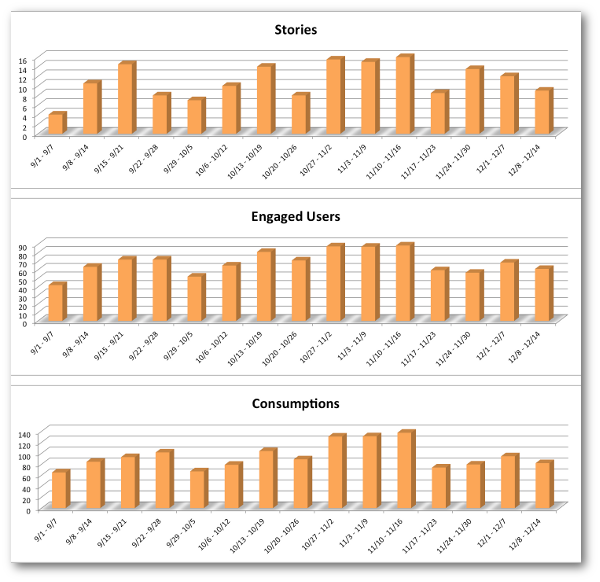
Well, that’s disappointing. I’d like to be able to say that I increased Reach based on my awesome content that was irresistible to users. But engagement clearly didn’t help boost Reach.
From AgoraPulse Barometer: It’s Not Just Me
So my next thought was that what I’m seeing may be an anomaly. I’m always slow to publish my results because I represent a very small sample size. What I want to know is whether other brands are seeing this.
Luckily, there’s the Barometer by AgoraPulse. This is a new tool and the sample size still isn’t huge, but about 750 Pages have been benchmarked. This includes Pages with audiences below 1,000 and more than 100,000 Fans. So it would give us some good insights.
Unfortunately, the Barometer measures Organic Reach instead of Total Reach, so our data isn’t going to be 100% consistent. But take a look at this chart that compares my Organic Reach to that of the other 750 Pages benchmarked on Barometer:
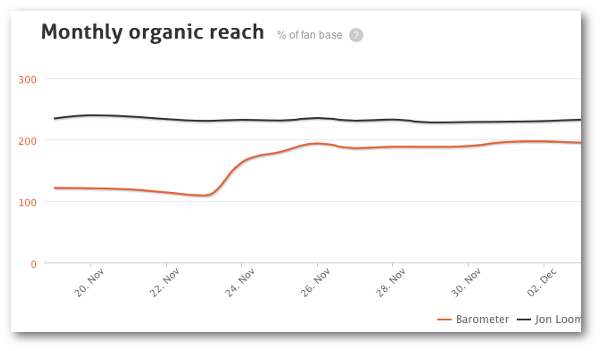
I zoomed in a bit because it’s otherwise difficult to read. Just know that there was virtually no change through December to the right of this graph.
Two things here:
- WOW! The average Page’s Organic Reach doubled starting November 24!
- Wait… My Organic Reach is unchanged!
I actually saw some of these same numbers in PageLever when I viewed Organic Reach more generally (instead of post-by-post). It doesn’t make a whole lot of sense to me.
On one hand, I’m seeing my Reach triple when looking at it on a post-by-post basis. This is supported within my Timeline, in my Export (when it works) and by PageLever.
On the other, this chart shows no change in my Organic Reach. Meanwhile, the typical Page is seeing the type of bump I was seeing with Total Reach, and at about the same point in time.
The only thing I can think of is that maybe I’m still reaching the same number of people month-over-month, but that Facebook is doing a better job of surfacing content to the people who matter on each individual post.
Maybe. But sometimes, the stats don’t make a lot of sense. Either way, I think there is enough here to say… well, there’s something strange going on.
What it All Means… Maybe
This is what I know:
- My Total Reach tripled starting at the end of November
- Many Pages saw a doubling of Organic Reach starting November 24
If you love Reach, that sounds pretty awesome. But as you know, I really don’t care about Reach.
If you trusted Reach, you’d expect a resultant bump in engagement. I have not seen that. While it’s dropped a little for me, it’s not consistent or long enough to be a trend.
Here are a few theories…
1. My Reach is up because I have a very low percentage of Negative Feedback.
According to Barometer, my Negative Feedback is far below the average of the other 750 benchmarked Pages. Facebook previously said that they adjusted EdgeRank to punish brands that were spammy. This could reflect that.
That sounds like a good explanation. I’d buy it if I was also seeing a resultant bump in engagement.
2. Facebook has changed the way that Reach is reported.
This is one of the reasons I cautioned you about relying on Reach. Facebook could say you reached 1,000 or 10,000 people, and you’d have no way of knowing for sure which was true. They could completely change the way they reported that number as well.
Since I’m not seeing any other changes in data, I would consider this to be quite possible.
3. It’s a Facebook bug.
Also possible. As I mentioned earlier, I’ve had serious issues accessing my Exports lately. This could be a sign that something is wrong under the hood. And if that’s the case, all bets are off with the data.
4. Facebook has increased the shelf life of a post
In addition to having the data to support that my Reach is up on a post-by-post basis, I also have a less scientific observation. It seems that I’m Reaching about the same number of people within the first couple of hours. But that number is increasing far more than it used to beyond that initial two-hour point.
It once was suggested that a post was essentially dead after two hours. I’m not seeing that right now, particularly if you rely on the totaling of Reach. This could be a sign that Facebook is doing a better job of bringing my content to the top for people who care most about it.
What Are You Seeing?
I’d love to hear what you’re seeing. Go through your Timeline. Check your Exports (if you can). Use PageLever and Barometer.
Is your Reach up? Let me know the results you’re seeing in the comments below!