Conditional Formatting is a feature found in Facebook ad reports that can be super useful for quick evaluations of performance. In this post, we’ll talk about where you can find this and how it works.
Let’s go…
Custom Ad Reports
First, know that this feature is only in custom ad reports right now, not the main Ads Manager. To access your custom ad reports, click the “Reports” drop-down at the far right of Ads Manager.
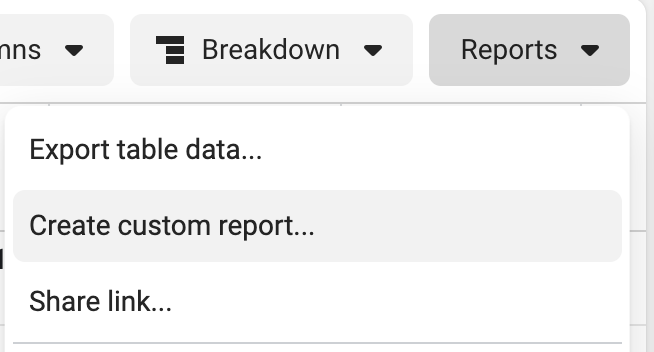
Then click ‘Create custom report.”
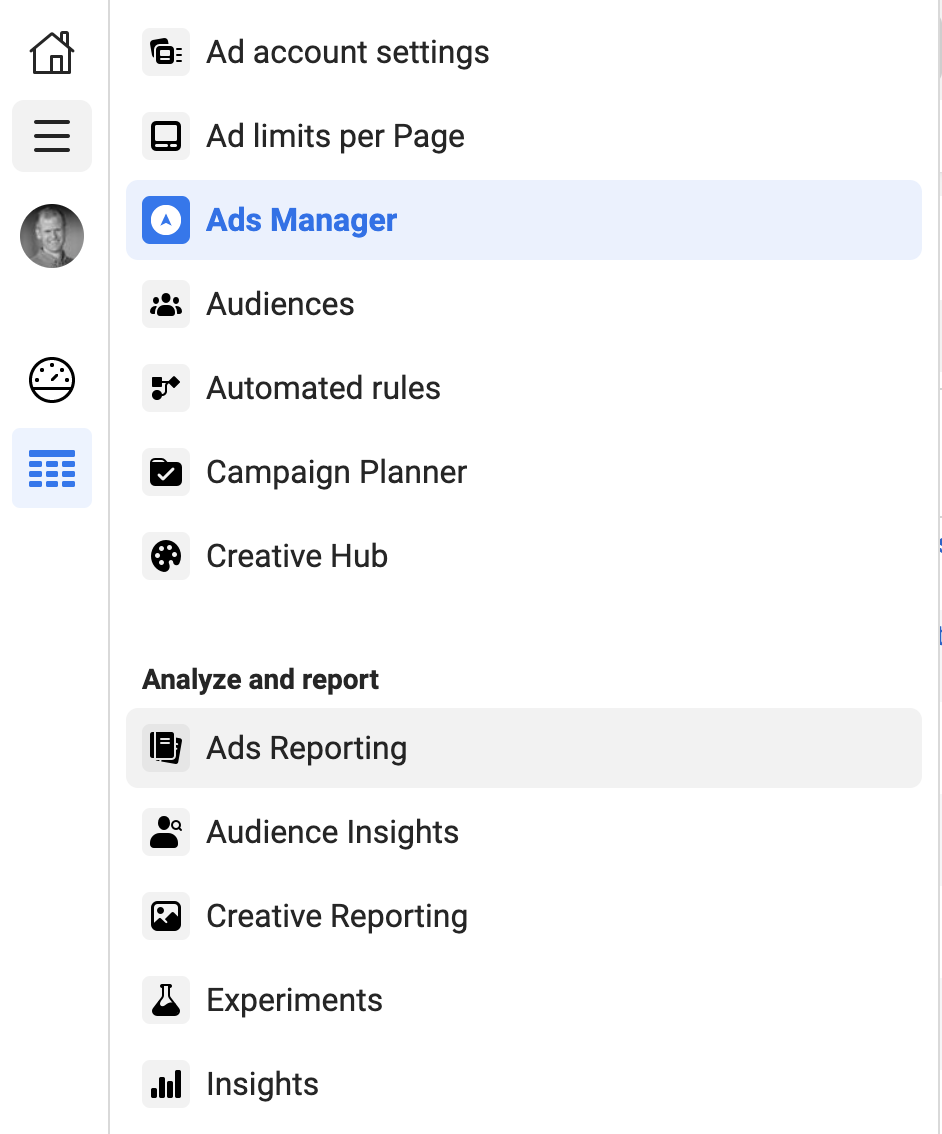
There’s technically another way there, though it’s more complicated. Click the hamburger menu at the top left and select “Ads Reporting” within the Analyze and Report section (assuming it’s not in your shortcuts).
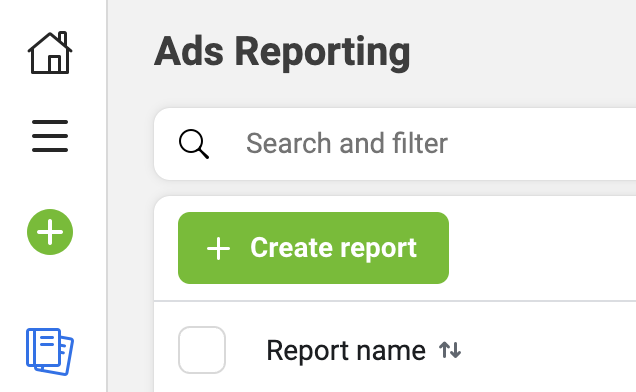
Click “Create Report” and select your ad account.
You should end up in a similar place. I prefer the first method. Not only is it easier, but it will use all of the columns I had saved within Ads Manager. Less set-up.
Add Formatting
Within a column that you want to add conditional formatting, click the down arrow button in the header row. Then select “format.”
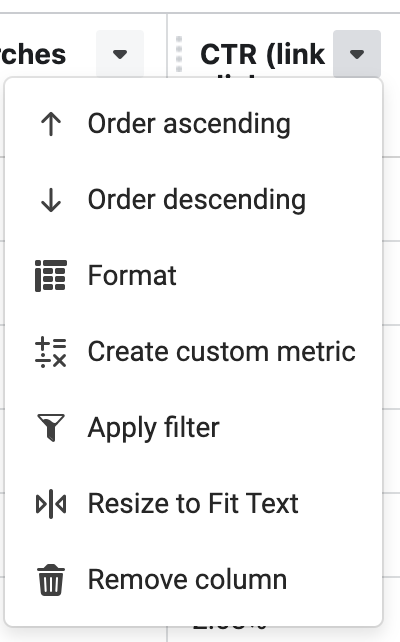
From there, create a condition to set the color of the cell.
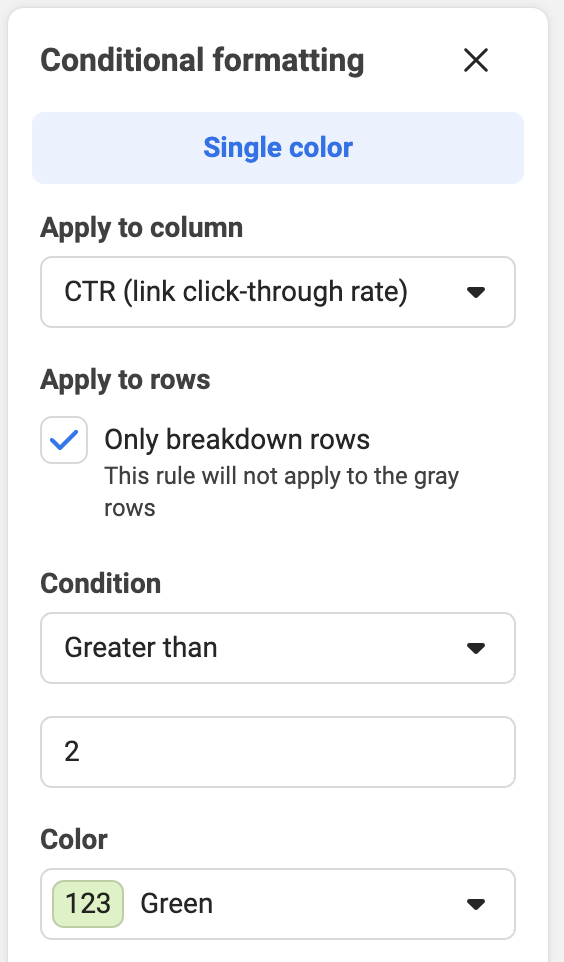
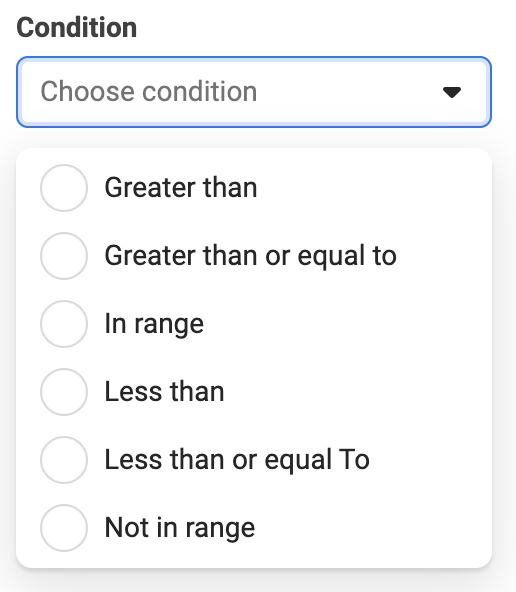
In the example above, I’ll make any cells with at least a 2.0% CTR green. Note that there are several options for conditions.
We can add more rules to include more colors for that column.
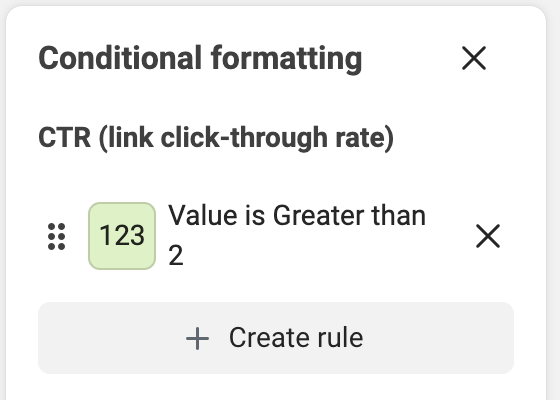
When we’re done, it looks like this…
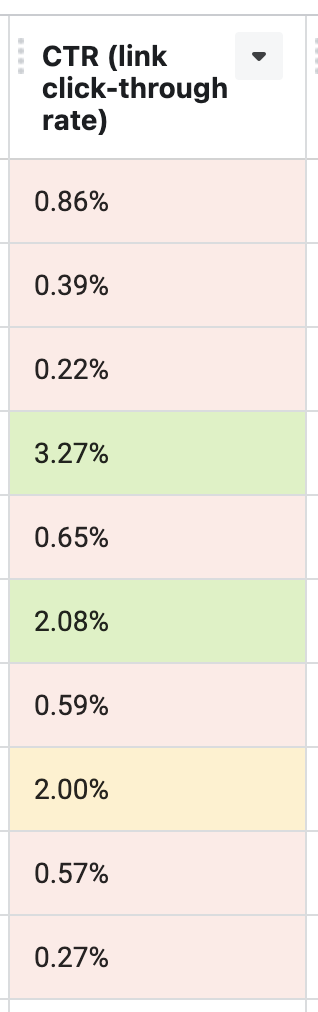
You’ll need to repeat this process for any important columns that you’ll want to focus on.
When you’re done, you’ll have a visual representation to help you quickly understand whether your ads are performing at, under, or above expectations.
The Problem With This
This is a really great addition. I have one big problem with it, though: I rarely ever use custom ad reports. I find it a duplication of efforts since I view performance within the main Ads Manager interface. I create saved columns to show everything that I need there.
Why can’t Facebook apply this to the main Ads Manager interface? Maybe (hopefully) this is just a testing ground. Many more advertisers would use it if it were in Ads Manager. It would be a valuable tool to have!
Your Turn
Do you use custom ad reports and conditional formatting? What do you think?
Let me know in the comments below!


