First of all, let me be clear about something: I really don’t care much about Facebook Reach. Our obsession with it is all wrong.
I care about actions. And a high Reach doesn’t necessarily mean high engagement, link clicks, registrations or sales. Just as getting those actions doesn’t necessarily mean high Reach.
Additionally, when it comes to Reach I care more about how many people are being reached in a given day, week or month — the single post isn’t that important.
But since people care so much about the Reach metric, I want to be sure you are at least measuring it properly. So the purpose of this post is to step you through a process to uncover “true” percentage of fans reached with a single post that you’ve likely never tried before.
The Problem With How You’re Measuring Reach Percentage
First of all, the typical marketer incorrectly assumes that Organic Reach or even Total Reach is the equivalent of Fan Reach. Not true.
Total Reach is the total number of people you reached — fans and non-fans, paid and unpaid.
Organic Reach is the total number of people you reached without advertising — fans and non-fans.
So when you take a ratio of Total or Organic Reach over total fans and say that’s the percentage reached? Completely wrong.
But even if you do know how many fans you reached, chances are that your methodology is still a complete mess.
Let’s say you have 50,000 fans and you published a post that reached 5,000 of them. While that does indeed mean you reached 10% of your fans, it misses a very important point.
The problem here is that we’re so hung up on Facebook’s News Feed filtering that the common refrain is that Facebook kept 90% of our fans from seeing that post. That’s incredibly far from the truth.
A few more than half of your fans will be on Facebook every day. And of those on, they’ll only be there during certain times.
So while you may have only reached 10% of your fans with a post, you shouldn’t have been expected to reach a big chunk of them.
The trick will be to find how many you should have been expected to reach.
The Solution
In a perfect world, you’d be able to compare the number of fans reached to the total number of fans who were online and could have seen the post. While there are holes in what I’m going to tell you, it’s far more accurate than current methods.
I am going to show you how to find the following:
- Total Number of Fans Reached With a Post
- Total Number of Fans Online When it Was Posted
- Percentage of Fans Reached Who Could Be Reached
This method won’t consider fans who have hidden all of your content. It won’t consider fans who saw or could have seen your post more than an hour after it was published. It’s not perfect. But it will provide a much clearer picture into your true percentage of fans reached.
1. Download Post and Page Level Exports
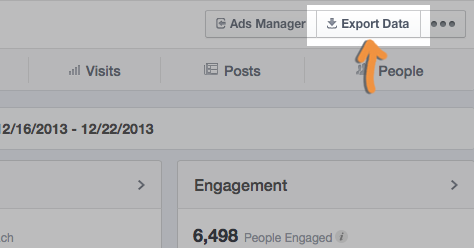
Go into your web Insights and click the “Export Data” button.
Then pick a time period that ends no more recently than a week ago and starts about five months prior to that. I’m using 9/14/2013 – 3/14/2014.
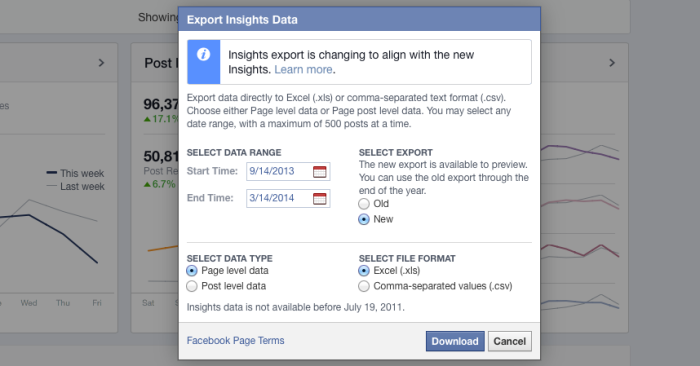
You’ll want to use the “New” export, and separately download both the Post and Page Level versions.
2. Find the Total Number of Fans Reached Metric
This sounds simple, but few marketers know how to find this.
It’s not the Total Reach — that includes fans and non-fans, paid and organic. It’s not Organic Reach — that includes both fans and non-fans.
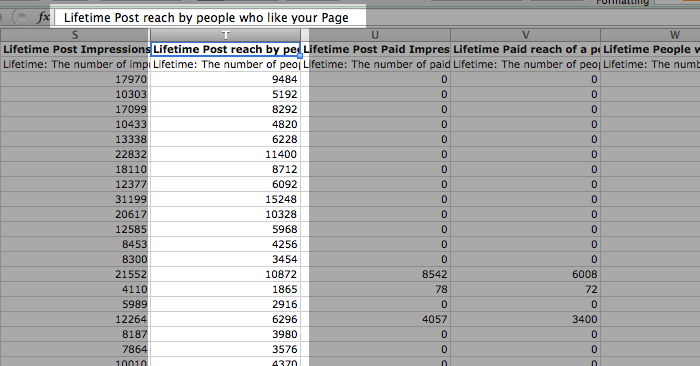
Within the Post Level Export, go to Column T of the Key Metrics tab (the default view).
If you occasionally promote posts like I do, you now have two options:
- Eliminate all posts that were promoted
- Subtract fans reached via ads (Column V) from total fans reached
Since I promote a decent number of posts, I’m going to do the second. While this will eliminate all fans who were reached both organically and paid, that’s actually the way Facebook measures Organic Reach now anyway.
I then clean up my document to include the following columns:
- Permalink
- Type
- Posted
- Total Reach
- Organic Reach
- Fan Reach
- Paid Fan Reach
- Organic Fan Reach
It’s up to you how much of this information you want to keep. But I feel it will be helpful when understanding why one post did better than another.
3. Focus On Specific Posts
You’re going to see why momentarily, but let’s focus only on posts that were published within five minutes of the top of the hour. So you could use anything published between 8:55 and 9:05, for example.
The result for me is a sample size of 78 posts. Following is the breakdown by +/- 5 minutes on the hour (my local time):
- 0:00 – 4
- 1:00 – 3
- 7:00 – 3
- 8:00 – 7
- 9:00 – 5
- 10:00 – 5
- 11:00 – 6
- 12:00 – 9
- 13:00 – 4
- 14:00 – 2
- 15:00 – 3
- 16:00 – 3
- 17:00 – 2
- 18:00 – 1
- 19:00 – 5
- 20:00 – 1
- 21:00 – 5
- 22:00 – 6
- 23:00 – 4
4. Find the Total Fans Online During Those Times
The reason we’re focusing on +/- five minutes from the top of the hour is because Facebook provides data on how many of your fans were online during that specific hour on that specific day within the export.
If you posted at 7:30, there’s less confidence that a high percentage of your fans who were on during the “7:00” hour could have seen your post since some would have come on before you published.
So the key is to document all of those who were on Facebook within an hour after you published because the expectation is that if they could have seen it they would have.
Now, you probably know that there is a “When Your Fans Are Online” section of the web Insights. This is nice, but it’s for a “recent 1-week period.” The export provides exactly how many fans were on for the specific day and hour in question.
Within your Page Level Export, go to the final tab called “Daily Liked and Online.”
Here you’ll see how many of your fans were online to see any post from any source during each particular hour on each day.
If you are slick with Excel, you can run some formulas to pull this info and put it into your spreadsheet. Otherwise, you’ll need to add it manually.
5. Find the Percentage of Possible Fans Reached
Now, simply divide the Organic Fan Reach by the Total Fans Online for that particular hour on that day, and you’ll get a more accurate percentage of potential fans reached.
My Results
There are many different directions I can go with this. Let’s break down the highlights…
Highest Percentage of Possible Fans Reached: 78.7%
I created this text update on October 26 at 7:05pm that organically reached 4,978 of a possible 6,326 fans online:
What’s crazy is that it didn’t receive all that much engagement.
I had three other posts that reached at least 70% of my possible online fans. Two were text updates and one was a link. Two were in October and one the day after Christmas.
Lowest Percentage of Possible Fans Reached: 3.5%
This photo shared on November 26 at 11:55am reached a miserable 361 of a possible 10,374 fans online:
Well, the problem with that is we know this isn’t accurate. For the longest time, Facebook has misreported reach of cover photo updates.
Second Lowest Percentage of Possible Fans Reached: 6.0%
Since the cover photo share numbers aren’t accurate, let’s go to the next post. This is a link share on December 23 at 8:05am:
Note that this post did receive advertising, which would have negatively impacted the number of fans reached organically. But it’s also two days before Christmas, which may not have helped.
Average Percentage of Possible Fans Reached: 27.4%
Frankly, my results are across the board, as you can see. But on average, I can expect to reach a little more than a quarter of the fans who are currently online.
Percentage of Possible Fans Reached by Month
Take this for what it’s worth since we’re looking at small sample sizes. But here you go (number of posts in parentheses)…
October (17) – 44.1%
November (11) – 29.6%
December (15) – 23.5%
January (19) – 23.8%
February (8) – 20.8%
March (8) – 26.3%
Percentage of Possible Fans Reached by Post Type
The results here shouldn’t be a surprise based on what we know. But keep in mind that text updates aren’t getting the same advantages as they once did (number of posts in parentheses)…
Link (46) – 23.5%
Text Update (21) – 40.5%
Photo (11) – 31.4%
Percentage of Possible Fans Reached by Paid vs. Non-Paid
The results heavily favor organic reach of fans when not paying (number of posts in parentheses)…
Paid (11) – 19.2%
Non-Paid (67) – 28.9%
It’s easy to distort what this means. Some will say it means you shouldn’t promote posts. Stop…
Remember again that Facebook has changed the meaning of Organic Reach. If you reach a fan both organically and paid, Facebook now only counts the paid event. Therefore, the Organic Reach is underreported, and these two are likely much closer.
Percentage of Possible Fans Reached by Hour
We’re going to have serious sample size issues, but I present this data anyway…
0 (4) – 31.5%
1 (3) – 20.7%
7 (3) – 20.5%
8 (8) – 25.7%
9 (5) – 14.8%
10 (5) – 29.9%
11 (6) – 23.3%
12 (8) – 24.6%
13 (4) – 24.8%
14 (2) – 15.9%
15 (3) – 21.9%
16 (3) – 26.3%
17 (2) – 43.5%
18 (1) – 28.2%
19 (5) – 33.1%
20 (1) – 18.2%
21 (5) – 43.1%
22 (6) – 55.4%
23 (4) – 33.7%
It doesn’t surprise me a whole lot that I reach a high percentage of fans late at night. Less competition.
But also keep in mind that I rarely (never) promote those posts. So they are at an advantage due to the way Facebook reports Organic Reach.
Conclusions
I won’t say I have black and white conclusions. But I enjoy digging into this data.
Since the information used here has imperfections, we can’t say for sure just how many fans were kept from seeing my posts. But this does provide a closer idea of just how many were being reached and the circumstances surrounding that.
While I may be reaching an average of 9.3% of my total fans with a single post, the truth is that I’m reaching closer to about 27% of those I have the chance of reaching.
How much of that is because fans have hidden my content? How much of that is due to Facebook’s News Feed filtering? It’s tough to say, but I at least have a better sense of the answer now than I did prior to this study.
Your Turn
Go ahead and try this yourself. What percentage of your possible fans are you reaching with a single post?
Let me know in the comments below!


