Any screenshots and details of functionality may no longer be relevant.
There’s been a LOT of chatter about Facebook Page Reach in general lately. More specifically, there’s been talk of how Reach is down for photos while it’s up for status updates.
Not just a slight change. But a major change to the EdgeRank algorithm.
Is this true? If so, is this simply a cosmetic change? Has engagement been impacted?
My Experiment
For the past several months, I’ve been using photos almost exclusively when sharing my latest blog post every Monday through Friday mornings. I decided to stop last Monday and use only status updates.
I have taken the five photo posts that I made from October 22-26 and compared them to my five status update posts I made from October 29 to November 2.
Note that there are other status updates and photo posts mixed in, but I wanted to compare only the posts that were made to promote a new blog entry. Following are the posts that were used:
10/22 Photo about spam impacting Promoted Posts (Part 1)
10/23 Photo about spam impacting Promoted Posts (Part 2)
10/24 Photo about Fan Page Friday
10/25 Photo about how to merge Facebook Pages
10/26 Photo about Andrea Vahl interview
10/29 Status update about a change in Reach
10/30 Status update about the silent killer of Reach
10/31 Status update about not marketing on Facebook
11/1 Status update about Facebook Page Notifications and Pages Feed
11/2 Status update about Emeric Ernoult interview
Read to the End!
Let me say this now. It’s important that you read everything here. While some of my findings verify what everyone is reporting, there is so much here to understand.
Is Reach up with status updates? Yep. Am I skeptical? Yep. Does it matter? Probably not.
Read on…
Facebook Reach — WHOA!
Everyone claims that Reach is way up for status updates and that photos aren’t being seen by anyone. So let’s look…
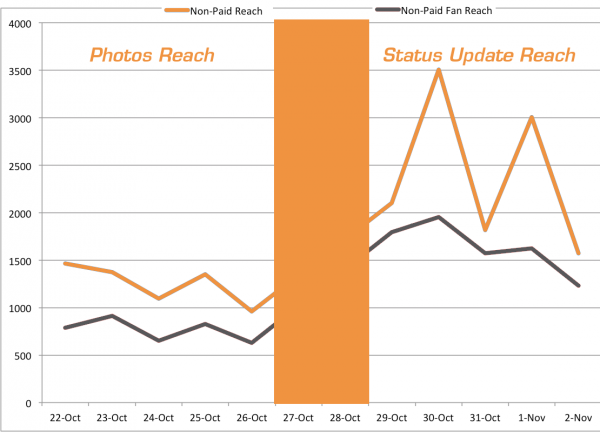
Average Reach for status updates was about 2,400 while it was just under 1,250 for photos. Status updates were reaching an average of 1,635 fans while photos reached only 761. Even when using medians, the difference was close to double.
That’s crazy, right? But it is consistent with everything we’re hearing. Status updates way up, and far outperforming photos.
If you only look at Reach, of course…
Facebook Engagement — Wait, What?
One might assume that if Reach is way higher for status updates that engagement follows. After all, if you can’t reach an audience, they won’t engage.
Quick refresher. Here’s Facebook’s definition of “Engaged User:”
The number of people who clicked anywhere in your posts.
Simple enough, right? So that’s likes, comments, shares, photo clicks and other clicks. Here’s what we’ve got for that same set of data…
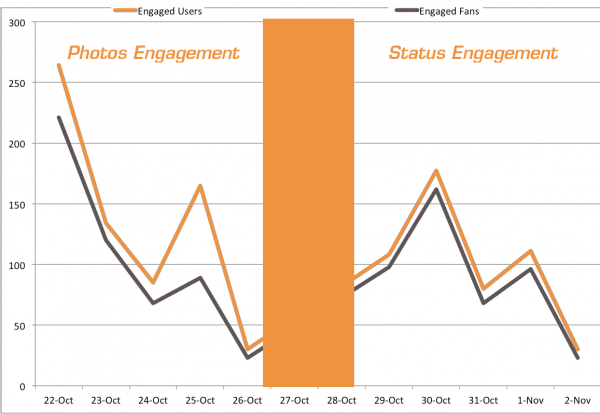
To the naked eye, at least, these appear to be pretty even. Big spike in the beginning for photos, but they average out.
The actual numbers are consistent with the eye test. Let’s use medians for now on to avoid one piece of data that skews the results (as could happen in this set here). I had a median of 89 engaged fans and 134 total engaged users for the photos; it was 96 and 108 for the status updates.
In other words, I was getting virtually the same engagement from fans, but the photos actually got me more engagement from non-fans.
The difference is nothing definitive. But what is clear is that the engagement is very similar even though the Reach was no where close.
But I want more details than clicks anywhere within the posts. You’re probably thinking that photos have an advantage here because of photo clicks. I was thinking the same thing.
So let’s look at a few more sets of data: Likes, Shares, Comments and Other Clicks. And this time, let’s just look at the median scores for each…
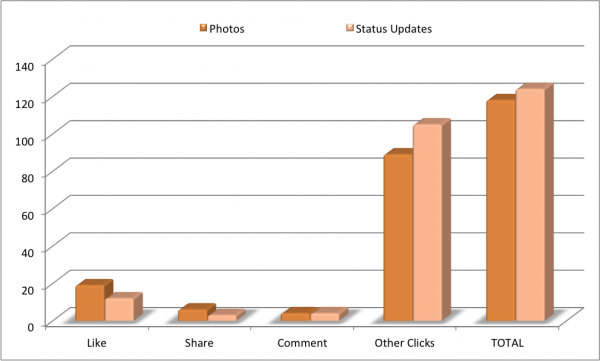
Huh. So my photos got more likes and shares, comments were the same and status updates got more “other clicks” which resulted in more clicks overall.
By the way, you may be wondering how I found this data. It’s on the “Lifetime Post Consumers by type” tab of the post level export in Facebook Insights.
What Does It All Mean?
If you’ve detected some frustration in my words lately, this kind of stuff is exactly why.
Reach stats don’t tell us anything. This goes back to the very odd Viral Reach stats we’ve seen since the end of August which resulted in a drop in Total Reach. I’ve been tracking my Reach and Engagement closely for months now, and while Reach has become extremely erratic, my Engagement continues to trend upward.
So now that we’re talking about the difference in Reach between post types, I stand firm that this stat means nothing. The proof is the engagement.
I see virtually no difference in engagement between status updates and photos of similar content. That tells me one of two things regarding the Reach numbers, which are double in favor of status updates:
- Status updates are getting half of the engagement per user; or
- The Reach numbers are wrong.
Either way, I don’t really care. I can’t prove Reach. I can prove engagement. And engagement is what we all care about, right?
Your Turn
The problem, of course, is that I’m only one person. While my individual sample size is enough now to say that I have not been negatively impacted by poor Reach during the past few months, it doesn’t mean that my results apply globally.
So what are you seeing? Your Reach between your status updates and photos are likely quite different. But what about your engagement?
Let me know in the comments below!

