Facebook Insights is a wonderful tool when used properly. But the data is so extensive (and the updates often unreliable) that many page managers ignore their Facebook Insights completely.
The purpose of this tutorial is to not only explain why you should use your Facebook Insights but to show how you can use them to determine what and when you should post on your page for maximum effectiveness.
The Data Available in Facebook Insights
Most page managers look through what is available in the web version of Facebook Insights and stop there. The truth is that the power of Facebook Insights can be found in the downloadable spreadsheets.
Granted, this data is a bit overwhelming. Everything you can possibly want is in there. Anywhere within your Facebook Insights you can export either Page Level or Post Level data to Excel or a CSV file.
There is so much information that it’s difficult to list it all here. But I’ll try to provide an overview.
The Post Level data includes the following tabs of information:
- Key Metrics
- Talking About This Per Post, by Action Type
- Stories Created Per Post, by Action Type
- Number of People Who Click Within a Post, by Type
- Number of Clicks Within Each Post, by Type
- Number of People who Give Negative Feedback Per Post, by Type
- Number of Times Negative Feedback Given Per Post, by Type
And the Page Level data includes the following tabs of information:
- Key Metrics
- Daily Like Sources
- Daily Viral Reach by Story Type
- Weekly Viral Reach by Story Type
- 28 Days Viral Reach by Story Type
- Daily Viral Impressions by Story Type
- Weekly Viral Impressions by Story Type
- 28 Days Viral Impressions by Story Type
- Daily Total Frequency Distribution
- Weekly Total Frequency Distribution
- 28 Days Total Frequency Distribution
- And a bunch more…
There are 51 more tabs. Yeah, there’s a lot of information in there. So trust me that you can waste an entire weekend looking through it.
Determine the Best Day to Post on Facebook
I began writing this part step-by-step instructions on how to find the best day to post. I quickly realized that this ends up becoming an Excel tutorial as well, and as a result this became too much. So I’m going to assume you understand how to use Excel. Even if you have a working knowledge, you should be able to learn some things from the data.
Determine a period of time that you want to compare and export both the Post Level and Page Level data. I used two months, but it’s up to you.
From the Post Level data, let’s stay on the Key Metrics tab and focus on the following columns (feel free to delete the rest):
- Post ID (A)
- Message (B)
- Posted (C)
- Lifetime Post Total Reach (D)
The Page Level data provides Lifetime Total Likes in Column H of Key Metrics. This will allow you to find the percentage of Total Reach over Total Likes. This is important since the number of people you reach is significantly impacted by number of fans.
Once you find the percentage of Reach vs. Likes, you can then start sorting out what days provided the highest reach.
For me, it turns out that the best day to post is Thursday (25.1% reach) and the worst day to post is Saturday (21.6%). Not a huge discrepancy, but that 5% can make a difference.
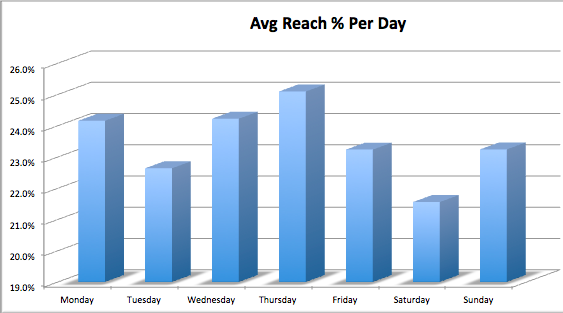
It should be noted that I posted far more often on Thursday (26) than Saturday (7) or Sunday (9). So the weekend data can be easily skewed. Otherwise, my worst days to post are Tuesday (22.6%) and Friday (23.2%).
Determine the Best Time to Post on Facebook
We use the exact same data we used above to find the best time to post. Within the “Posted” column provided by Facebook is both the date and the time. What I did hear was set a range for each time to create relevant sample sizes large enough to compare. So I used 6-6:59 AM, 7-7:59 AM, etc. (all times are Mountain).
What’s interesting is that 25% of my posts were between the times of 7:00 and 7:59 AM. This is above the overall average of 23.7%. So it’s not necessarily a bad decision to concentrate my posts at that time.
That said, there were certainly better times to post. I experimented recently when I heard it was best to post at less busy times, particularly at night. And that is reflected here. The best two times were from 8:00-8:59 PM (27.2%) and 10:00-10:59 PM (26.3%). These results should be taken with a grain of salt since I’ve only posted twice during each time range. But something to watch.
The two next best times to post were 12:00-12:59 PM (26.1% for eight posts) and 2:00-2:59 PM (25.7% for six posts). It looks like I should otherwise avoid posting between 8:00 AM and Noon as well as between 5:00 and 8:00 PM. These are the pockets where the lowest percentages of reach are concentrated.
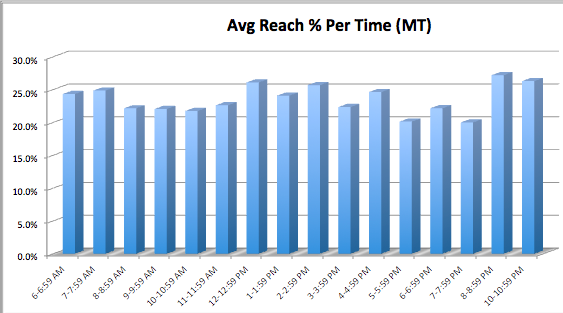
I wouldn’t suggest using my data as gospel, but keep in mind that all times are Mountain if you want to take anything from this.
Determine the Best Content to Post on Facebook
So now let’s look at what type of content I should be posting.This takes a little more manual labor as I don’t see anywhere that Facebook specifies what type of content it is that I shared. I also wanted to differentiate between my own links and sharing the links of others since I’ve noticed a difference in response between the two.
The types of content I shared in this analysis are as follows:
- My Own Links (68)
- Links of Others or Guest Posts of Others (27)
- Photos (3)
- Videos (7)
- Status Updates (26)
I could have gotten lazy here and stuck with Total Reach vs. Likes. But it seems we’re trying to find something different here: The content people are most likely to engage with.
You see, if we stuck with Reach the type of content wouldn’t hold much relevance. What doesn’t matter here is whether people see it. It’s that they interact with it.
And so, in place of reach I took the total number of people who “consumed” the piece of content. A consumption includes Talking About This (which is anything that creates a story) as well as any people who register a click that doesn’t count as Talking About This (link clicks, video clicks, photo view, and other clicks).
What I found is that people engaged with photos (4.0%) much more than any other type of content (0.9% for links, 0.7% for videos and 0.6% for both status updates and links of others).
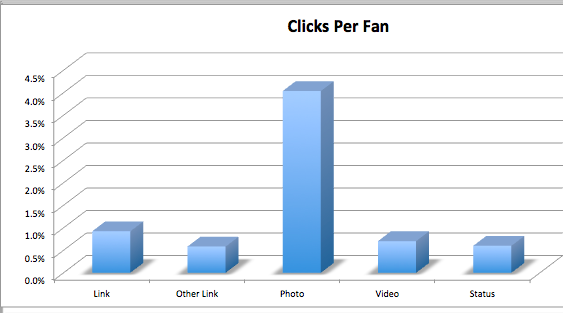
There’s an enormous caveat here. As mentioned earlier, only three photos are included in this analysis. So while those three photos were extremely successful, you can’t extrapolate these results over all photos.
What Can Be Learned
There are many factors that led to these results, and it’s not as easy as saying that I should post more Photos on Thursdays after 9:00 PM.
But there is still plenty to learn here. I should post more photos and see what comes of it. I should also continue the experiment of posting later at night (and this is going to be part of that experiment!). I should avoid posting in the middle of the morning and evening, and I should lighten up on status updates and links of others.
That’s what I see. What can you learn from your Facebook Insights?

