Any screenshots and details of functionality may no longer be relevant.
I just read a post on Mashable that says Facebook tab engagement is down 53% since the launch of Timeline. Time to confirm whether this grand statement applies to me…
I’ve written two related posts on this topic:
- On April 10, I noted that Facebook tab views were up 309%; and
- On May 11, I noted that tab views had leveled off to pre-Timeline ranges.
So what about the month and a half since then?
Overall Tab Views Still Up, Though Dropping
Let’s reminisce about some of the old tab data first:
- 14.6 daily tab views from March 1-26 (immediately before Timeline)
- 45.1 daily tab views from March 27-April 8 (immediately after Timeline)
- 23.2 daily tab views from April 9-May 10 (the cool down)
I was noticing a clear leveling out of tab views after an initial spike. The spike was likely driven by early curiosity that couldn’t be sustained.
So now that everyone is bored of Timeline, am I seeing the 53% drop in tab views reported by Mashable?
Nope.
From May 11 through June 28, I’ve seen an average of 21.4 daily tab views. Let’s break this down by week…
- Week 1: 21.9
- Week 2: 21.0
- Week 3: 19.3
- Week 4: 36.4
- Week 5: 18.9
- Week 6: 15.4
- Week 7: 16.7
The clear outlier is Week 4, which is far higher than the other weeks. The three most recent weeks are all under 20 daily tab views, but still above the 14.6 prior to Timeline.
Let’s take a look at a chart over time, displaying the daily tab views from March 1 through June 28…
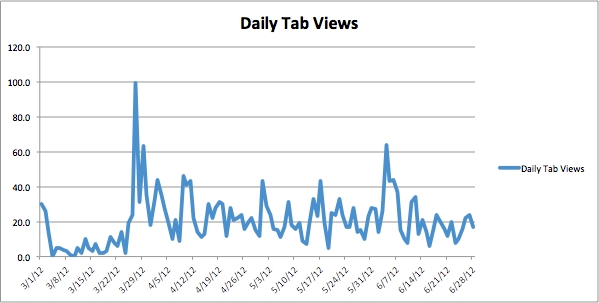
It’s all quite clear here. Tab views were very low prior to Timeline. They went crazy after the launch of Timeline. Tab views have since leveled off and continued to regress towards the mean.
Yet… the 16.7 tab views I am getting now are still higher than what I was getting in March prior to Timeline.
The Default Landing Tab Factor
It’s important to remember that prior to Timeline, my Facebook Page (like most others) had a default landing tab. Whether you wanted to view one of my tabs or not, non-fans were forced there.
This is an important distinction. Even though my tab views are beginning to approach pre-Timeline numbers, they are now viewed willingly. The vast majority of tab views before Timeline were forced.
The Caveat
What I’ve shown so far is based on raw numbers, mainly because the Mashable report was also based on raw numbers. But in the spirit of full disclosure and transparency, it’s important to note that my Like count has gone up significantly.
On March 27, I had 2,528 Likes. On June 28, my Page had 4,241.
In a perfect world, we could say that the percentage of tab views compared to Likes should rise to show an increase in activity. Yes, that is true. It’s also important to note that I had an issue with “optimized” ads that increased Likes by about 1,000. I’m convinced that many of those people have no interest in my Page and are therefore nearly unworthy of being counted.
But for the sake of argument, let’s compare the percentage of tab views over Likes from March 1 through June 28:
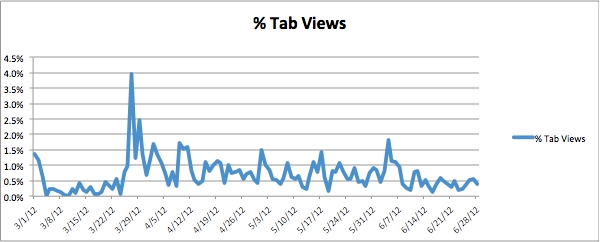
Done this way, the difference isn’t as pronounced. Yet, my Facebook Page is still getting more tab views now than it was immediately prior to the launch of Timeline.
In Conclusion
I’m always wary of grand proclamations from others. Tab views are apparently down by 53% for some people. That’s not the case for me. In fact, I’m finding that people are willingly viewing tabs (instead of being forced to view them) far more often than before.
Does this mean it’s the case for you and your Facebook Page? Of course not. Check your stats and let me know what you’re seeing!

