Any screenshots and details of functionality may no longer be relevant.
Two years ago today, I wrote the following post on my new Facebook Page:
My oh my, have things changed!
I wrestled with whether I needed a Facebook Page at all. It was more than two months after starting this website that I finally created my Page. Needless to say, it was a great decision!
Looking at these numbers, I can’t help but get a little sentimental. That first month was extremely hard. I wrote 39 posts during that month, and 26 of them didn’t receive a single comment, like or share. In fact, that first post embedded above didn’t receive any love until I reshared it today!
So since it’s been two years, I figured it was a good time to dig deep into my Facebook Insights and take a closer look at how things have evolved for my Page over time.
Following are charts for some top level Page data for Page Likes, Reach, Engagement and Negative Feedback.
Total Page Likes Over Time
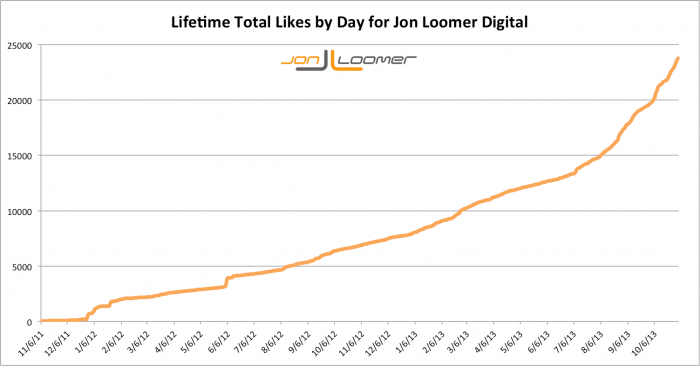
It wasn’t until June of 2012 that I reached 5,000 Likes. The next 5,000 took nine more months. But growth then increased more steadily as I reached 15,000 Likes five months later and 20,000 two months after that. I am now quickly approaching 25,000 at a break-neck pace.
New Page Likes Over Time
From this point forward, the charts will be showing the median daily stat on a monthly basis. The reason for this is that the spikes from day to day make it difficult to learn much about what is happening. Taking a median day, compared by month, I can show you how the metric changes on a typical day from month-to-month.
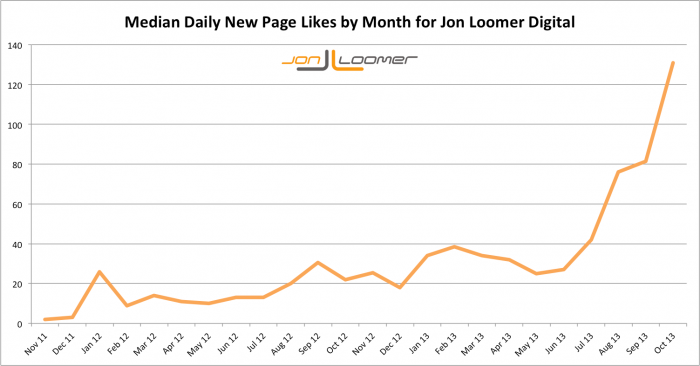
This chart provides more clarity regarding the spikes in Likes on a typical day. As you can see, there wasn’t much separating the typical day until August of this year. The main reason for that is a significantly larger investment in advertising.
We’ll get to more on that later!
Page Unlikes Over Time
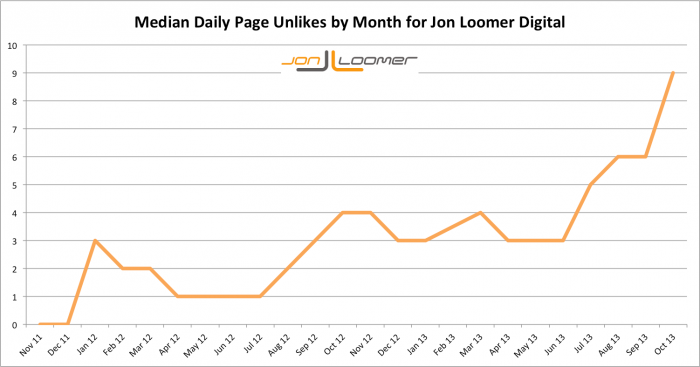
Since I’ve upped my advertising budget, it shouldn’t be a surprise that my daily Unlikes have also gone up. Advertising aside, one could expect that even if the percentage of unlikes remained the same, the raw number would increase.
As you can see in the chart above, the number of daily unlikes has gone up quite a bit beginning in July of this year. That’s expected.
Total Reach Over Time
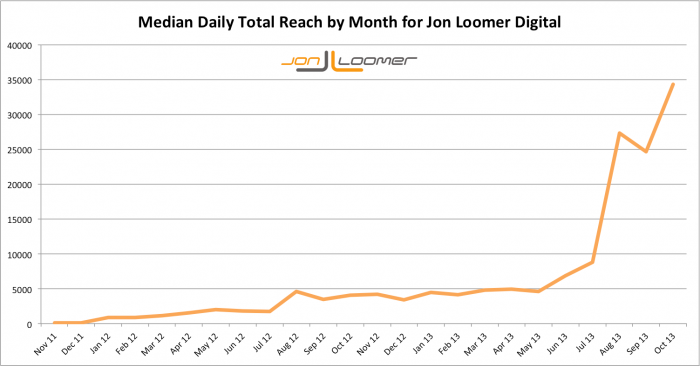
The first spike in Reach occurred in August of 2012. This is very likely related to the fact that Mari Smith and Amy Porterfield started sharing my content around then. It made quite an impact.
But the biggest boost happened in August of 2013, going from an average daily Reach of about 8,000 to 27,000.
The reason? Once again, it’s advertising.
Paid Reach Over Time
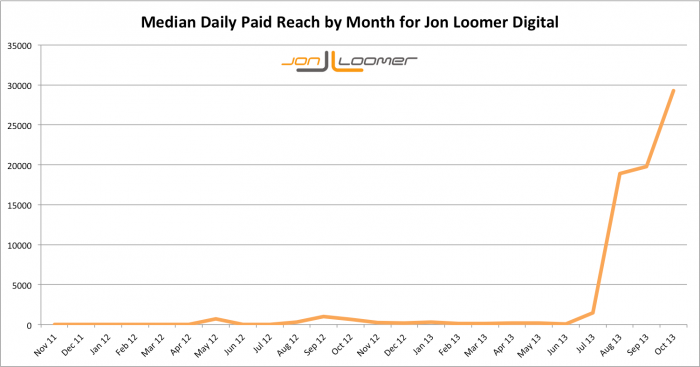
Now we can see this in action.
While I used ads a little for my Page beginning in December of 2011, most of that was through the use of coupon codes from Facebook. When those dried up, I rarely advertised on the typical day.
As you can see, I did experiment a little with advertising in May and September of 2012. But I was struggling to pay the bills, and as a result the amount I could invest in advertising was limited.
I wrote this post earlier this year detailing how much I spent during 2012 on my business. I spent less than $750 on Facebook ads.
These days, I spend more than $750 on Facebook ads during a given month. You can see that the biggest change once again occurred in July and August.
Organic Reach Over Time
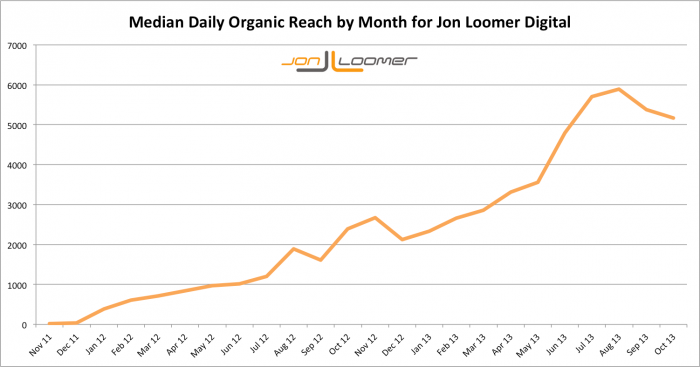
This chart allows us to see the change in Reach of my Page unaffected by ads. The growth has largely been steady, minus a recent drop — only after the biggest increase my Page has seen in two years.
Engaged Users Over Time
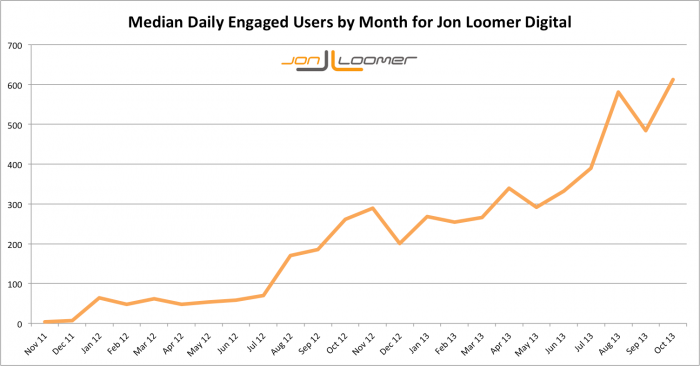
Is the increase in Reach resulting in an increase in engaged users? You bet!
Negative Feedback Over Time
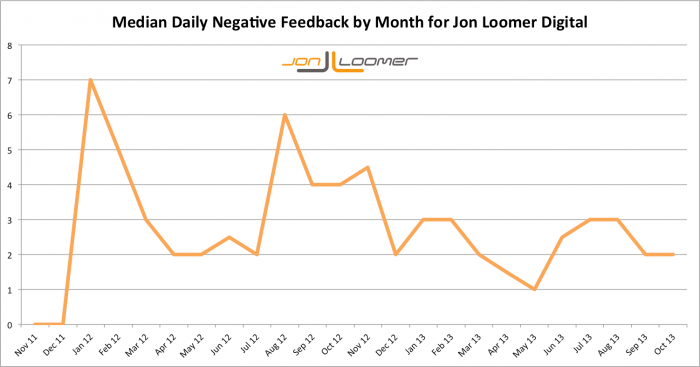
I find this interesting. The number charted here is not a percentage, but a raw number representing the median number of times users give negative feedback over time.
This number appears to be unaffected by number of Fans or amount of advertising. It would seem this is contradictory to the number of Page unlikes charted earlier.
What Does It All Mean?
Plenty can be learned from these charts.
First, don’t give up. During that first month — or even the first several months — I often felt invisible. Like no one read anything I wrote. But I fought through it, and I am certainly reaping rewards now.
Second, advertising is critical. My true growth — both in peripheral stats like Reach and Engagement and in critical stats like revenue — my Page didn’t truly take off until I decided to invest in my success.


