This is the good stuff. This is the feature that is going to save you loads of time typically dedicated to split testing. And as a result, it can also save you loads of money.
Ready? Let’s go!
What You Are Going to Learn Today
Today’s lesson is Editing Columns: Data Breakdowns. We’re going to focus on the following:
- What are Data Breakdowns?
- Use Cases
The Lesson
What are Data Breakdowns?
Possibly the most helpful feature is Data Breakdowns within Edit Columns.
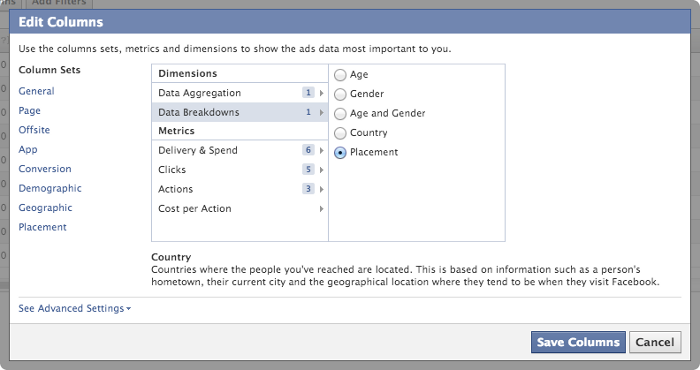
This allows you to view performance based on any of the following:
- Age
- Gender
- Age and Gender
- Country
- Placement
Use Cases
Let’s consider examples for each of these data types.
Age: Create one Page Like Sponsored Story targeted at all ages. When you run the ad report, you find out the following Cost Per Page Like:
- 18-24: $.48
- 25-34: $.42
- 35-44: $.18
- 45-54: $.29
- 55-64: $.63
- 65+: $1.04
What would you do? You’d probably focus more on age 35-44. And you’d likely eliminate ages 55+, depending on the sample size.
Age and Gender: Create an ad driving users to a landing page, measuring conversions. The ad report provides the following for Cost Per Conversion:
- Male 18-24: $1.98
- Female 18-24: $3.02
- Male 25-34: $1.87
- Female 25-34: $2.45
- Male 35-44: $2.54
- Female 35-44: $1.87
- Male 45-54: $3.45
- Female 45-54: $4.89
- Male 55-64: $5.43
- Female 55-64: $6.45
- Male 65+: $7.44
- Female 65+: $8.98
In this case, you may want to focus primarily on men, particularly under 35. However, you may want to create another ad just for women aged 35-44.
Country: You’re trying to get link clicks to your site, so you promote a post that targets four different countries. Following is the Cost Per Link Click:
- United States: $.47
- United Kingdom: $.89
- Canada: $.29
- Australia: $.14
You’d probably focus most of your efforts on Canada and Australia going forward.
Placement: You promote a video that goes to all placements, but you want to see which placement generates the most plays per dollar:
- Right Column: $.48
- Desktop News Feed: $.42
- Mobile: $.28
Might you focus only on mobile?
These are all examples. But you could also run a separate report for each Data Breakdown for a single ad (you can only pick one at a time). This could really help you zero in on the ideal audience and placement.
Keep in mind, however, that spend and sample size are important. Don’t make big decisions based on small sample sizes.
Your Assignment
Action Items:
- Analyze all of your ads from the past 30 days for Cost Per Page Like
- Find which Age, Gender, Country and Placement resulted in the lowest Cost Per Page Like