The world of advertising on Facebook and Instagram is dynamic. Managing effective ads requires constant learning, testing, and optimization. Marketers should utilize available data sources — particularly free sources — to better understand how the social platform landscape is shifting. We can use Google search data (via Google Trends) to identify social media opportunities – especially related to advertising.
To help make this process easier, we’ve developed a dashboard that captures and compiles a variety of search data — all based on Google Trends. You can access that resource here. This article highlights context for the dashboard and guides advertisers on how to approach using Google Trends as a powerful resource in their toolkit.
What is Google Trends?
Google Trends is a free, publicly available tool that we can use to identify search popularity for specific search terms, as well as general search topics.
A few caveats: The information is provided for aggregate groups of Google users, and is not traceable user-level data. Also, note that Google Trends does *not* report direct search volume data. Instead, it is intended to provide base data to compare changes in search popularity over time. Importantly, it also provides comparison for popularity between terms or topics.
The tool can be simple to use, but there are many nuances for understanding all the possible data comparisons. While this article won’t go into depth on all of the limits and considerations of Google Trends, I will cover some key points within the context of the Social Media Search Activity tool we have available on Jon’s site.
Why Does This Matter?
Search behavior is a fantastic indicator of what people care about. You can think of it as an unfiltered read on what problems people are trying to solve.
For advertisers, this can be a powerful source of understanding what people want to learn more about. Or, what services people are seeking. Best of all, you can understand how these interests shift over time. This enables an adaptive approach where advertisers can consistently adapt their offerings to match against human needs.
To better understand potential implications, let’s explore some examples….
“Facebook Ads” as a Google Search Interest
Below, we’ve used Google Trends to snapshot a single search query: Google searches including the term “Facebook Ads,” as measured over time:
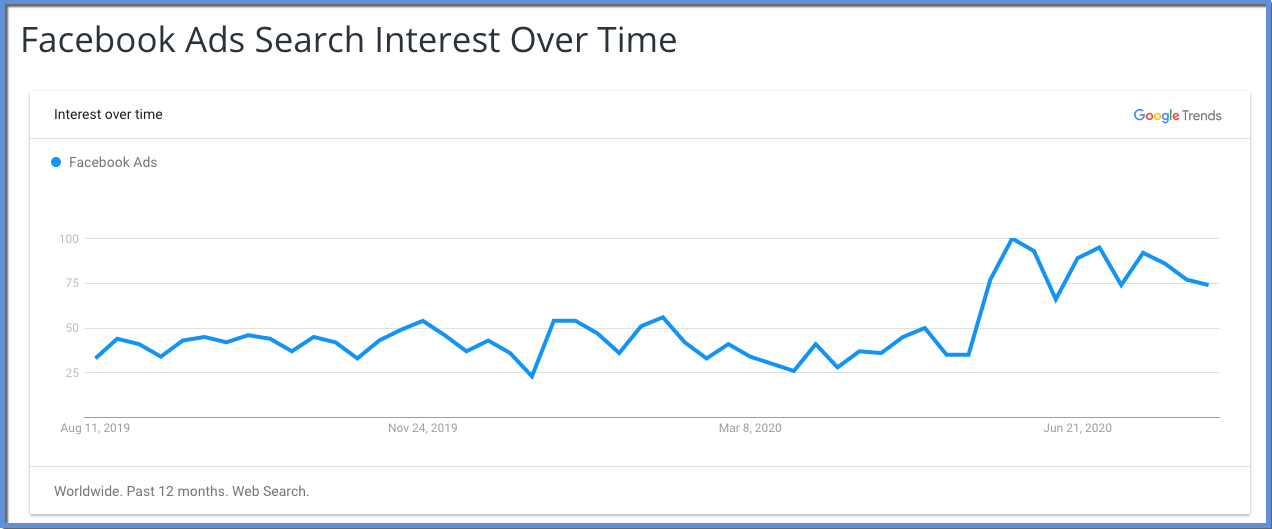 We’re looking here at a portrait of changes over time. Search popularity is presented on a scale from 0 to 100. Every chart you look at in Google Trends will be indexed in this way. This means that the high point is relative to whatever query or group of queries you are comparing in your data set.
In this specific example, we can see that there was a high point in the beginning of June 2020. We can also see that recent activity is continuing to be higher than any prior period. What this chart can not tell us is what may be driving that increased search interest. We can look more deeply at “Related Queries” (which is covered a bit later in this article) to explore potential drivers of changing patterns.
To dive deep, we can segment specific time ranges and evaluate related queries just for an isolated point in time. As an example: we can look just at the beginning of June 2020, and then see how Related Queries compare during that period vs. some other time frames when popularity may have been less for a similar search term. Needless to say, the topic of Related Queries deserves its own series of articles.
In the meantime, on to the next component…
Google Searches of “Facebook Ads” vs. “Instagram Ads”
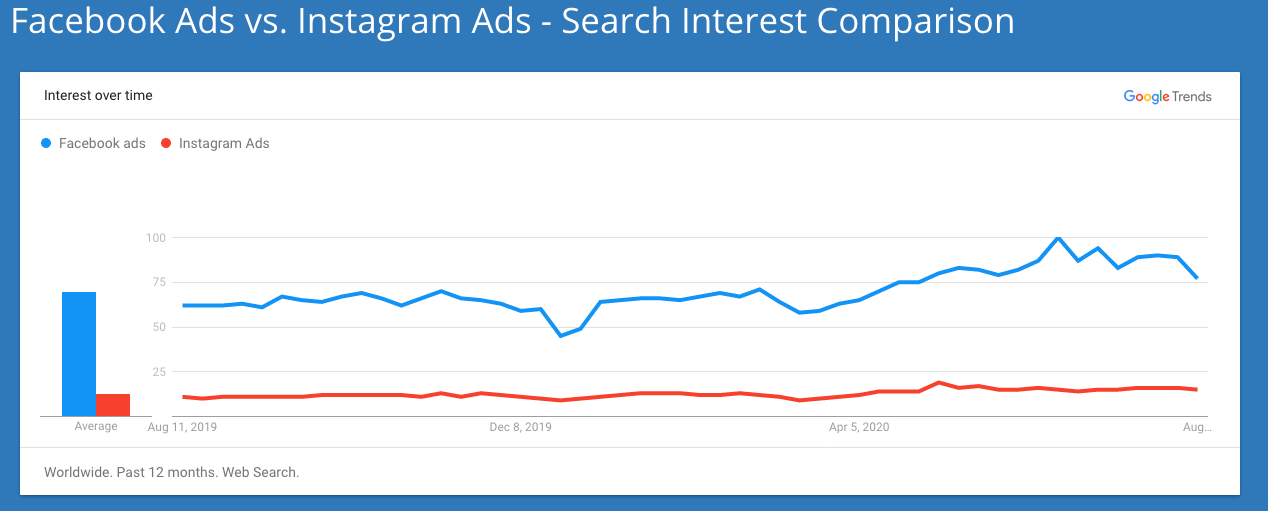 Here we’ve added a second search query to compare, so we can see “Facebook Ads” vs. “Instagram Ads.” Notice how we still see the same high point in early June for Facebook Ads.
However, the addition of “Instagram Ads” to our research shows that, generally speaking, searches for Instagram ads are far less popular than searches for Facebook ads. We can also see that the volatility in search popularity for “Facebook Ads” is not as evident in searches for “Instagram Ads.”
Comparing Google Searches for “Ads” on Various Social Media Platforms
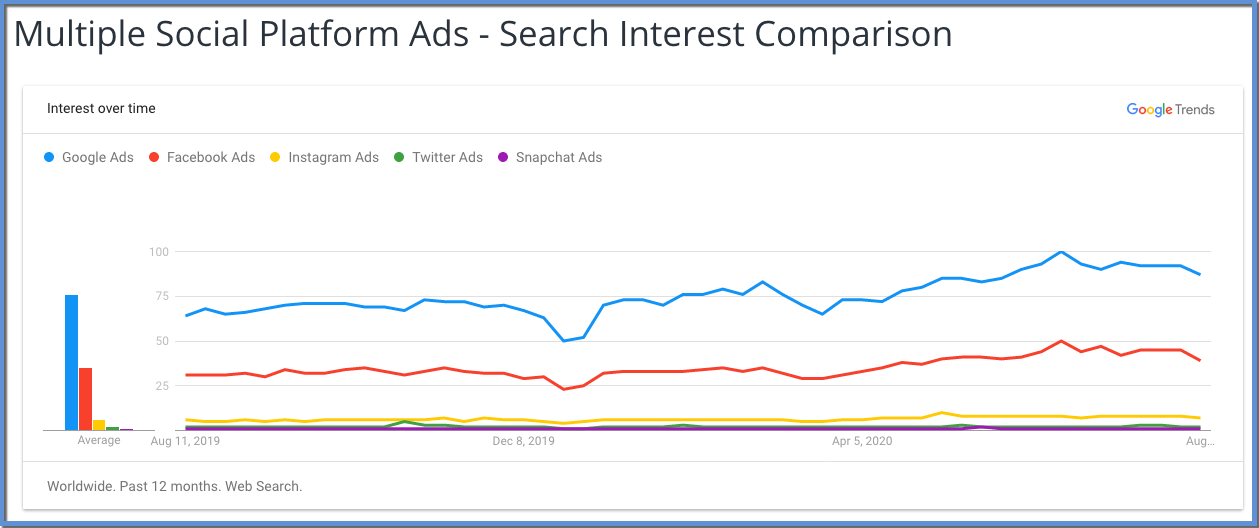 Now we’ve added additional social media platforms to our same advertising research term comparisons, including Google Ads, Twitter Ads, and Snapchat Ads. We can add up to 5 queries in any single view.
The snapshot above shows that search popularity for “Google Ads” is about twice as large (in popularity) compared to “Facebook Ads.” Additionally, “Google Ads” and “Facebook Ads” both experience similar changes in search popularity over time.
For some extra nerdy fun, you can export the underlying comparison data and calculate correlations between terms. Again, this may be material for a future article. However, I can share that “Google Ads” and “Facebook Ads” are highly correlated in this comparison. In this specific example, they have a correlation of .94 (whereas a score of 1.0 would be a “perfect” correlation). Meanwhile, “Facebook Ads” and “Instagram Ads” have a correlation of 0.86, which is also quite strong. This means that searches for “Google Ads” are more highly correlated with “Facebook Ads” than the same for “Instagram Ads”. Both comparisons have a strong correlation overall. These are interesting findings that we could explore more deeply.
Identifying Potential Opportunities based on Related Search Queries
We can look at how “Related Queries” differ between the search activity for various social platforms. Google Trends defines “Related Queries” as “users searching for your term also searched for these queries.” In this example, we’ll look at “Top Terms”, which are further defined as “terms that are most frequently searched with the term you entered in the same search session, within the chosen category, country, or region.”
Here in our homemade dashboard, we’ve pulled data for search popularity of “ads” for the different platforms, and placed these results into a side-by-side view for comparison:
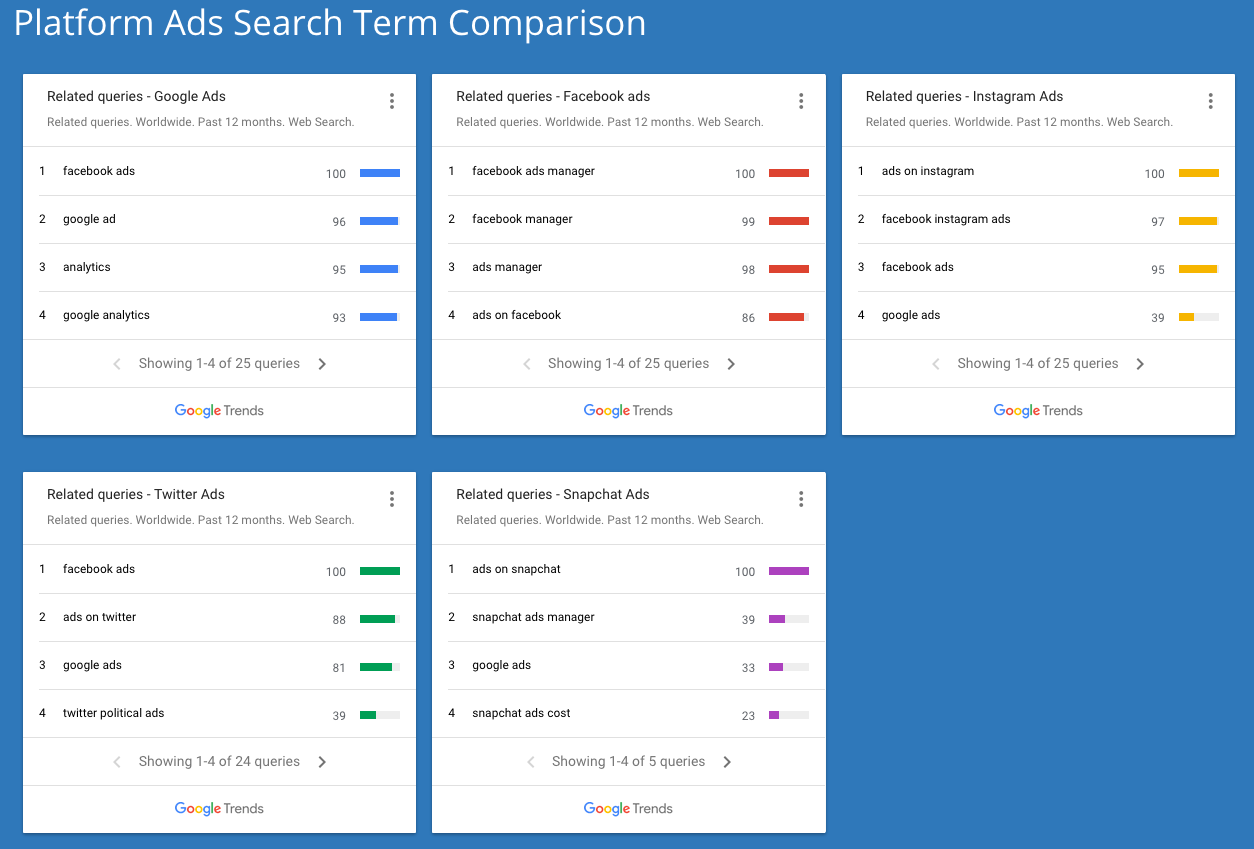 We can learn quite a bit from this single view. First, “facebook ads” is the most common related query for searches for “Google Ads”. This is an indication of what we found in the correlation assessment earlier. People looking for information on Google Ads are often ALSO searching for Facebook Ads in the same search session. We can also see that people are often looking for information on “google analytics” in similar sessions that they are looking for info on “Google Ads”.
Meanwhile, with Facebook Ads we can see that “ads manager” is a common theme. This is an indication that people are seeking information on the Facebook ad buying interface. If you are in the space of offering services for advertisers, such findings can be a potential source of important insights.
Assessing Risks and Threats for your Social Media Platforms
Search data can provide a way for us to assess interest in a certain action that could be considered negative to a brand or cause. Deleting a specific platform is an example:
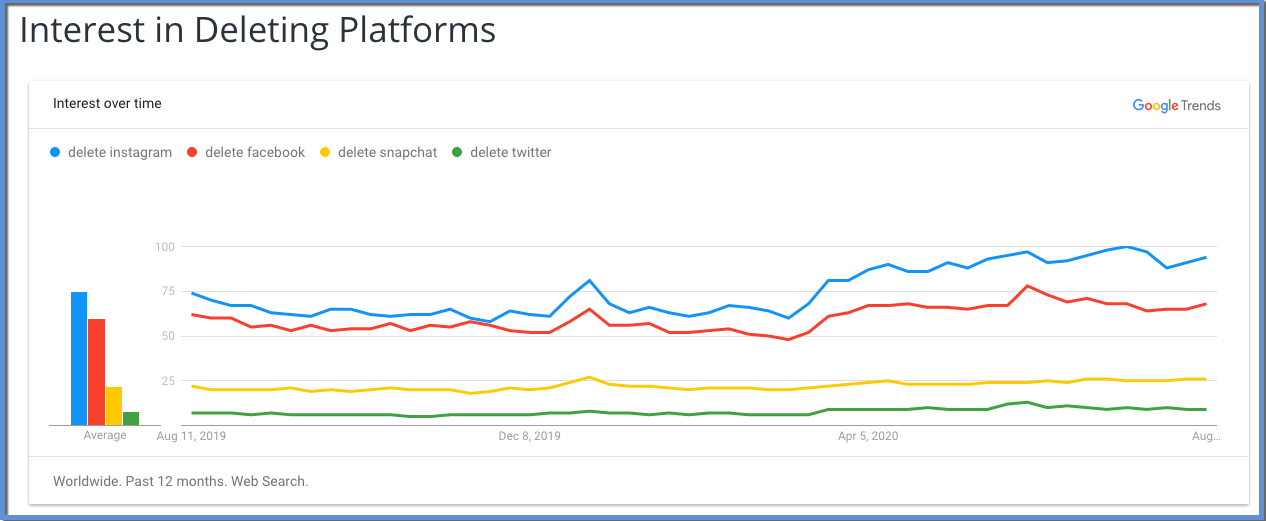 Here, we can see that interest in “deleting Instagram”is actually higher than “deleting Facebook.” This may be a surprising finding.
Again, as with other areas of search, there is opportunity for us to dive much deeper. The point is: there is insight in being able to explore and compare searchers’ activity regarding these social media platforms. It’s also interesting to be able to see when spikes happen. Or, to see how those spikes may –or may not– correlate, such as Facebook and Instagram in our example above.
Comparing Searches for Facebook Advertising Terms
Google Trends provides the ability to compare essentially any search term(s). We can apply that to an analysis more directly looking at search terms related to “Facebook Ads”:
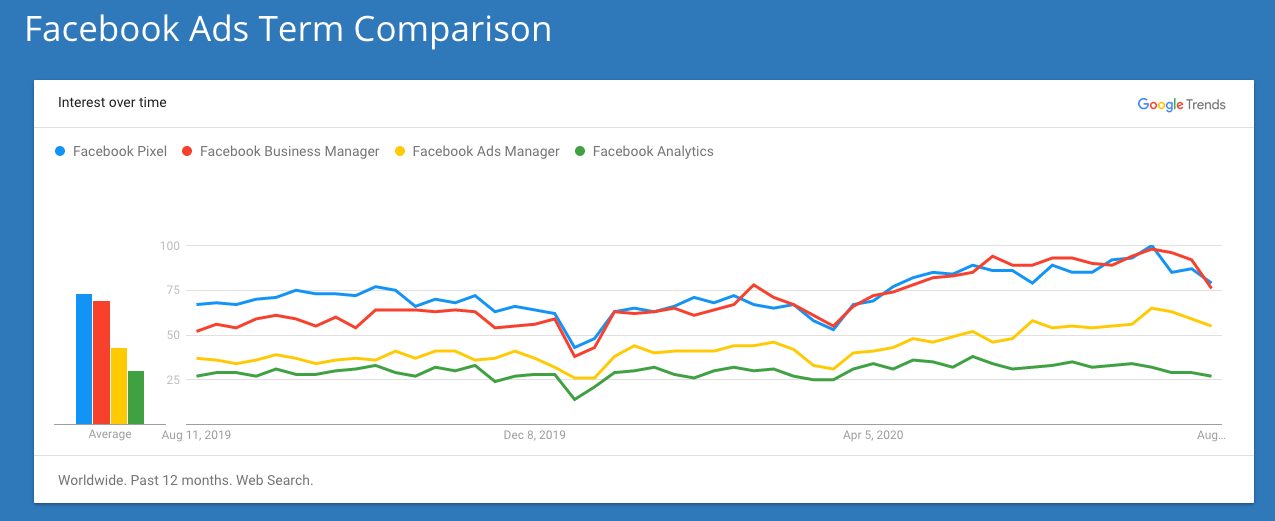 An interesting finding from this is the strong association between searches for “Facebook Pixel” and searches for “Facebook Business Manager.” It’s also interesting to see how the popularity of searches for “Facebook Pixel” is actually higher than all of the other comparison searches here. If you are in the business of offering services related to Facebook Ads, focusing on the pixel could be an opportunity.
Search Data and Social Media: Powerful Possibilities
There are countless potential applications for using the information available from Google Trends. The dashboard we’ve provided is intended as a starting point for understanding generalities of how search trends can inform us about what’s occurring in the social media advertising landscape. Hopefully, the search data tool is useful for quickly identifying opportunities for social media. Or, at least to serve as the starting point for a deeper dive.
Feel free to bookmark the dashboard resource. The Google Trends information will stay updated over time, automatically. We’ll also plan to keep human-crafted written commentary, updated regularly.
Your Turn
How are you using Google Trends to identify advertising opportunities or threats? Do you find the dashboard we’ve developed useful?
Let us know in the comments below!


