I was very curious about how this experiment would play out. In particular, how many of those who opted in to the experiment would last until the end?
While the following data isn’t complete, I wanted to provide an overview of what I saw through 11 tips. This can provide an inside look at user commitment and fatigue.
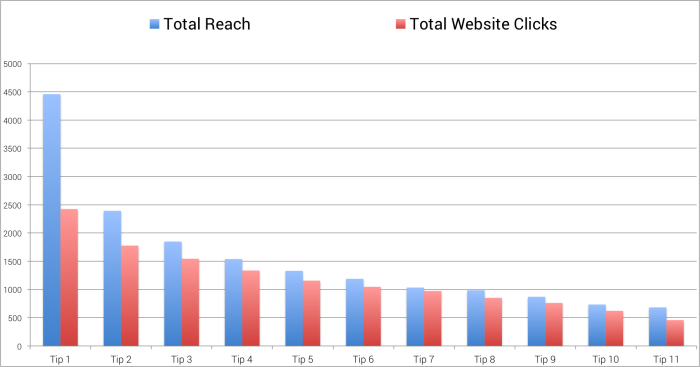
Total Reached and Website Clicks
One of the main goals of this experiment was to see how much participation would drop off over time. So I would need to have enough tips to intentionally fatigue some in the group.
As you can see in the chart above, there were about 4,500 people who were interested enough to participate in the experiment. Those 4,500 or so people were those who initially clicked my first invitation ad — or the link from my blog post about the experiment.
But were they excited to participate? It would look like only half were all that excited. The rest can probably be classified as “curious” since fewer than 2,500 of those initially targeted for Tip #1 actually clicked the link.
That first tip did the best job of separating the curious from the engaged. I wasted more money serving ads on that tip than any other since there’s a large group who had no plans to click (I stopped serving them ads after 14 days since the initial opt-in). On the flip side, the vast majority of those served the other tips ended up clicking (as can be noticed by the similarities in bar size for reach vs. clicked).
Let’s look at that in a different way…
Percentage Clicked
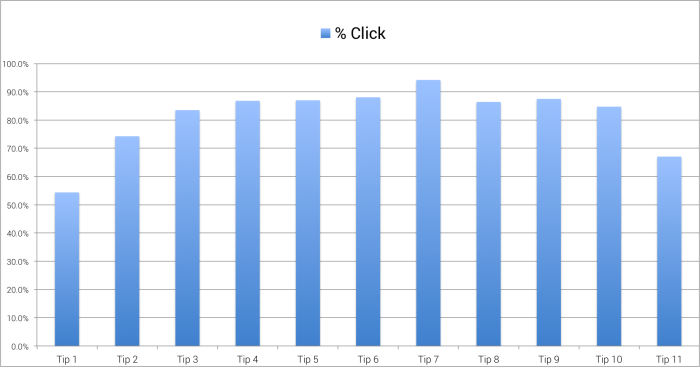
As you can see, just over 50% of those who were served Tip #1 clicked on it. That’s kind of ridiculous since it’s ran for more than a month. Lots of waste there.
But more than 74% of those served Tip #2 clicked it, and from that point forward more than 80% of those served any tip other than Tip #11 clicked. In fact, an astounding 94% of those who were served Tip #7 ended up clicking it.
Note that this doesn’t mean that those who served the ad immediately clicked it. I’m instead looking at total website clicks over total reached — so many of these people were shown their ads multiple times. This also doesn’t include website clicks on ads served organically (a phenomenon covered previously).
I see very little fatigue here. You may say that Tip #11 is evidence of fatigue, but the stats I’m showing here cover only two days of activity. Those results are not complete, and I expect that bar to continue to grow for a few more days.
Instead, we are seeing natural attrition. We lost about 45% of the audience with the first tip and an additional 26% for the next. After that I lost anywhere from 6-17% per tip. So over time, the audience did continue to shrink, but not at the same rate as it did in the beginning.
That leads us here…
Percentage Reached
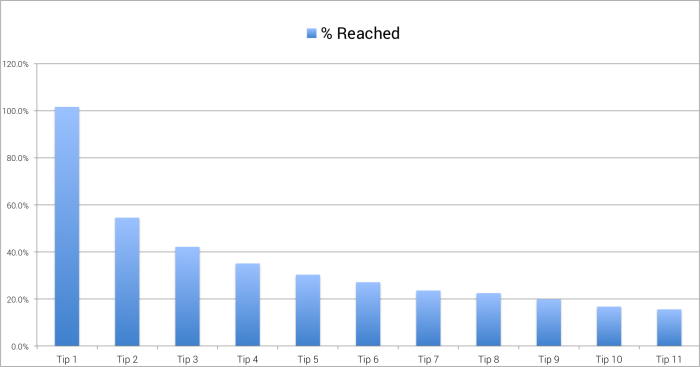
I want to be clear about what this chart represents. While I know there were some complaints from participants saying that they aren’t seeing the ads, the percentage of those who should see a given tip (Reach vs. Previous Tip Clicked) is close to 100% for every tip. That’s not what we’re looking at here.
Instead, we’re looking at that natural attrition that I referred to above. Of the initial group of about 4,500 people who wanted to participate, how many people were reached for each tip? This gives us an idea of the size of our audience at each stage compared to the beginning pool.
The number reached for Tip #1 was actually slightly over 100% because of my blog post about the experiment. But as you can see, it dropped off quickly from Tip #1 to Tip #2.
Things did level off — and the experiment isn’t complete heading into Tip #12 — but I was reaching a number of people that was between 15-20% of the initial participant pool.
What Does This Mean?
I think this is just interesting data in general. It means a lot of things and nothing at the same time. But a few things strike me…
First, there is something to be said here about putting too much value on an impulse action. Yes, I got 4,500 people to agree to participate in my experiment. However, nearly half of them never clicked on a single tip and only about 40% made it beyond Tip 2.
We get excited about initial actions. Some marketers use tricks and shady practices to get users into their funnel. But some of those people acted impulsively and hold very little value.
What I see above is that I have a core of 600-1,000 really valuable prospects. I may even use this group for future targeting — or for the creation of Lookalike Audiences.
Second, it appears that once you shave away the “I’m not really that interested after all” group, what’s left is a group that is pretty darn committed and loyal. In fact, I’d say that fatigue was non-existent here for the most part — and that will be limited if you continue to provide value.
And that’s the underlying lesson here. Use ads in unique and exciting ways to surface content that the target audience values. When you do that, some pretty amazing things can happen.


