This experiment fascinated me for many reasons. But possibly the most fascinating was the organic distribution of ads.
When I started the experiment, the priority was to surface content to people who wanted to see it. The vehicle used for this was ads. I never considered the impact that could result — both positive and negative — from organic distribution.
Viewing Organic vs. Paid and Activity
First, research for this is painful. Since content was distributed via ads only — not a post to my page — Facebook’s Insights won’t list these ads to break down organic and paid distribution. I had to get creative, and some data is left out.
When I receive a notification from my page on the desktop about activity on an ad, I’m redirected to the permalink for that ad. That way, I can take a closer look at total reach, organic reach, paid reach and see how people have engaged with the ad.
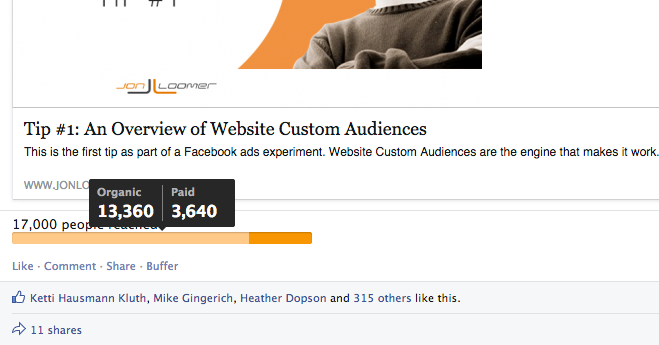
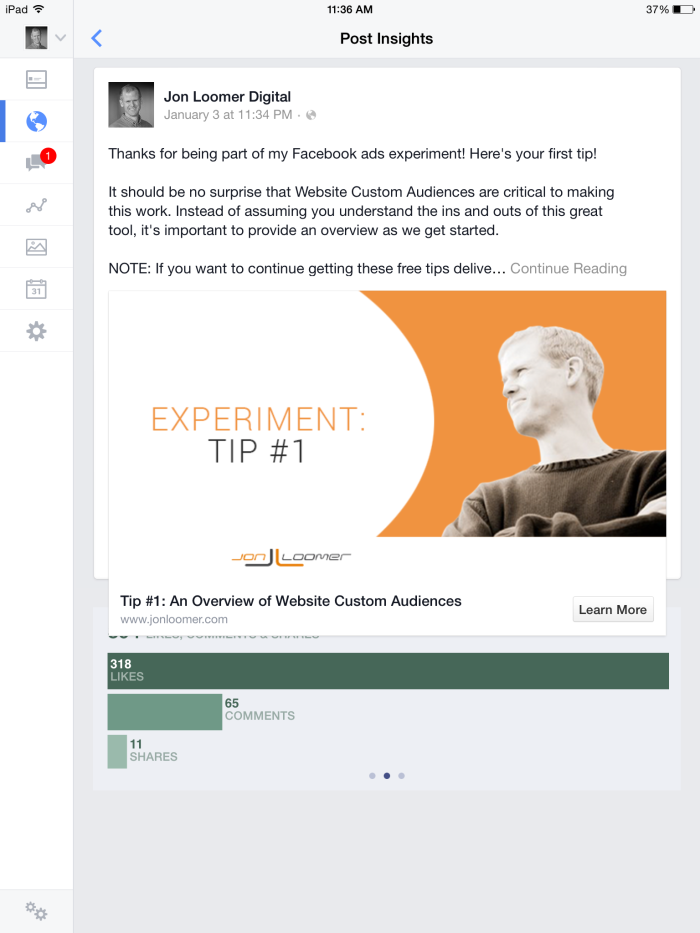
However, the desktop doesn’t report on total number of likes, comments, shares and website clicks when viewing these permalinks. I can figure out the likes quickly and I could add up the comments (that would be a lot of work in some cases), but the shares shown here are only those who did so publicly.
Thankfully, the Pages iPad app provides more info. It provides an overview of all comments, likes and shares…
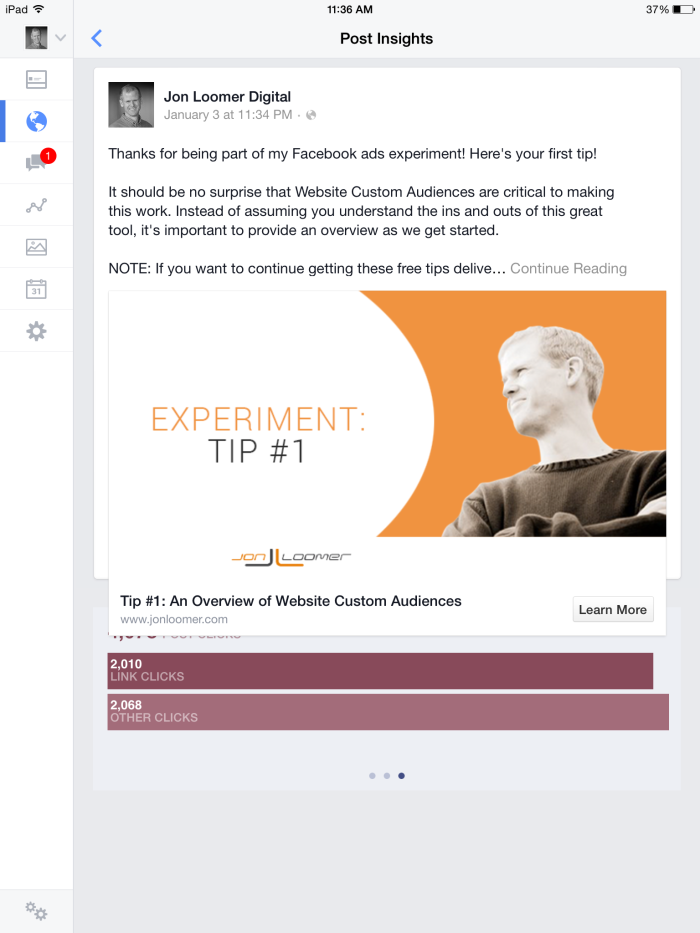
And it breaks down link clicks and other clicks…
I was limited in the results I was able to pull. There’s currently a bug in the Activity Log, so I was not able to view that. I was only able to view notifications from the past seven days. However, that still gave me enough data to look at 17 total ads.
I also am unable to accurately match up these ads to the info found in custom ad reports. Data must be updated at different rates, and it just ended up being too much of a hassle.
But that doesn’t really matter. The main point of this tip is to help you understand what can happen when an ad that was intended to be only an ad gets distributed organically.
Organic vs. Paid Distribution by Tip
Here’s an overview of organic vs. paid distribution of ads through the first nine tips. Keep in mind that this is an incomplete list for the reasons described above.
- Tip 1 (Ad 1): 13,360 Organic vs. 3,640 Paid (78.6% Organic)
- Tip 1 (Ad 2): 360 Organic vs. 1,834 Paid (16.4% Organic)
- Tip 2 (Ad 1): 7,208 Organic vs. 1,628 Paid (81.6% Organic)
- Tip 2 (Ad 2): 1,006 Organic vs. 1,010 Paid (49.6% Organic)
- Tip 3 (Ad 1): 4,200 Organic vs. 1,312 Paid (76.2% Organic)
- Tip 3 (Ad 2): 315 Organic vs. 645 Paid (32.8% Organic)
- Tip 4 (Ad 1): 3,408 Organic vs. 956 Paid (78.1% Organic)
- Tip 4 (Ad 2): 768 Organic vs. 574 Paid (57.2% Organic)
- Tip 5 (Ad 1): 262 Organic vs. 364 Paid (41.9% Organic)
- Tip 5 (Ad 2): 258 Organic vs. 420 Paid (38.1% Organic)
- Tip 6 (Ad 1): 331 Organic vs. 212 Paid (61.0% Organic)
- Tip 6 (Ad 2): 80 Organic vs. 227 Paid (26.1% Organic)
- Tip 7 (Ad 1): 1,961 Organic vs. 961 Paid (67.1% Organic)
- Tip 8 (Ad 1): 2,416 Organic vs. 872 Paid (73.5% Organic)
- Tip 9 (Ad 1): 443 Organic vs. 230 Paid (65.8% Organic)
- Tip 9 (Ad 2): 212 Organic vs. 242 Paid (46.7% Organic)
- Tip 9 (Ad 3): 270 Organic vs. 385 Paid (41.2% Organic)
A couple of points are in order here…
First, just a reminder that this is an incomplete list. For each tip, there is data for at least one ad missing, sometimes more. So don’t look into the variations of reach too much since an important ad may be missing (though the number participating will indeed drop with each tip).
Second, it’s important to understand how Facebook now measures organic and paid reach. Let’s say I reached you with an ad. You later saw that organically. Facebook only counts you as having seen it paid. As a result, I consider the organic reach numbers to be under reported — which makes it even more amazing!
Nine of these 17 ads had more organic than paid reach even though I published them only as ads (one was basically 50/50).
The average distribution was 70.4% organic. Of course, that’s heavily weighted by the first ad for Tip 1 which received a ton of organic distribution. The median organic reach is 57.2%, which is still amazing!
I feel like I have to keep repeating this over and over because it’s important to remember: These ads were only published as ads. The organic distribution was a bonus, yet they drove the majority of eyeballs.
What Drives Organic Distribution?
The easy answer is that it’s engagement. When someone comments, likes or shares it, others — who may not be part of the experiment — will see it.
However, what isn’t clear is which actions drive the most organic distribution of ads. Let’s take a look at post like rate, comment rate, share rate and link click rate…
Post Like Rate (Post Likes/Reach)
- Highest: Tip 9 Ad 3 – 3.5% (41.2% Organic Distribution)
- Lowest: Tip 6 Ad 1 – 0.9% (61.0% Organic Distribution)
Well, post like rate sure doesn’t seem to matter. Tip 2 Ad 1 (which received 81.6% organic distribution) had a post like rate of 1.7% for reference, which is right in the middle.
Comment Rate (Comments/Reach)
- Highest: Tip 8 Ad 1 – .70% (73.5% Organic Distribution)
- Lowest: Tip 5 Ad 2 – .15% (38.1% Organic Distribution)
There could be a connection here. Although Tip 2 Ad 1 has a comment rate of .33%, which is again in the middle.
Share Rate (Shares/Reach)
- Highest: Tip 1 Ad 2 – .50% (16.4% Organic Distribution)
- Lowest: Tip 3 Ad 1 – 0% (76.2% Organic Distribution)
There are actually several ads that didn’t receive a single share, but I focused on Tip 3 Ad 1 because that clearly didn’t hurt organic distribution. Three others without a share received at least 50% organic distribution.
In other words, not a strong correlation.
Link Click Rate (Link Clicks/Reach)
- Highest: Tip 3 Ad 2 – 94.5% (32.8% Organic Distribution)
- Lowest: Tip 4 Ad 1 – 2.4% (78.1% Organic Distribution)
Now this is just insane. Website clicks clearly have no impact on organic distribution.
Something else to consider is that engagement rates may be higher for posts early in the campaign. In fact, I guarantee that they are. So that could be part of the reason those rates are low for the earlier tips — and could throw off my numbers.
Something else to think about that may be a major factor: When I replied to a comment on an ad, people routinely told me that they were seeing the ad organically.
It’s not clear if a page’s interaction with a post is weighted more heavily, but that is a very real possibility. And it’s motivation to engage with ads!
Negative Impact of Organic Distribution
It’s rare that this will be a problem, but organic distribution created some very real issues for this experiment. Keep in mind that I have very strict controls on this — I want to show specific ads to specific people and I want to exclude specific people as well.
When organic distribution is over 50%, some chaos can ensue. And that happened.
People would repeatedly tell me that they were seeing an ad multiple times even though they had already read that tip — something that should have excluded them. In all likelihood, this was due to organic distribution.
People would tell me that they opted out of the experiment but were still seeing the ads. This is also likely due to organic distribution.
People would tell me that they were seeing tips out of order. Very likely due to organic distribution.
And finally, there was the issue of the occasional troll. This was rare — particularly within the tips themselves — but it will happen due to organic distribution.
Lessons Learned
Overall, I learned several things here.
First, it’s very difficult to put tight controls on who sees your ads. While you will pay to reach the right people, organic distribution will throw that off.
Second, while the jury is still out on this, I’m convinced that one of the most important contributing factors to organic distribution of an ad was my participation in the comment thread. If you want to reach more people — whether it’s an ad or an organic post — engage more with users in that post!

