

[AUDIO VERSION: I also recorded an audio version of this blog post. Click below to listen. Let me know if this is something you find helpful!]
I conduct several one-on-one coaching sessions every week, and each time I ask my 45-minute client whether they use the ad reports. More often than not, the answer is, “Ummmm… what?”
As a result, I regularly take 15 minutes in these sessions to create a saved report that they can use in the future. Time and time again, these people are blown away by the information available to them.
But most advertisers don’t realize this information even exists. When used, you can optimize your ads for age, gender, country and placement.
In other words: Get better results and stop wasting your money on placements and demographics that aren’t working.
[Tweet “Here is how to monitor performance of your Facebook ads by AGE, GENDER, COUNTRY and PLACEMENT.”]
Facebook Ad Reports
If you monitor the performance of your ads diligently, you can limit waste and focus budget on what is most effective. Your results will differ depending on the audience and placement of your ads.
This is done through split testing. In the past, the only way to accomplish this was through creating many different ads for age groups, gender, country and placement. But that’s no longer required.
The magic is found within Facebook’s ad reports. The old version of these reports was more or less worthless. As a result, advertisers ignore them. But an update last year makes them one of the most powerful tools in an advertiser’s tool box.
On the left hand side of your Ads Manager, click on Reports…
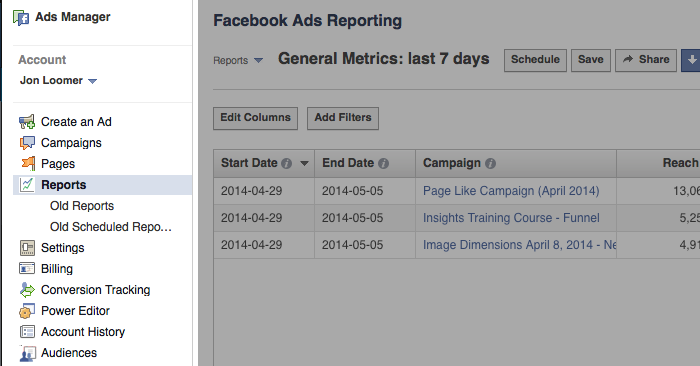
The default report isn’t particularly useful, and it’s why most advertisers don’t dig in more. It provides 17 columns of data for all campaigns run during the past seven days:
- Start Date
- End Date
- Campaign
- Reach
- Frequency
- Impressions
- Clicks
- Unique Clicks
- Click-Through Rate (CTR)
- Unique Click-Through Rate (uCTR)
- Spend
- Cost Per 1,000 Impressions (CPM)
- Cost Per 1,000 People Reached
- Cost Per Click (CPC)
- Actions
- People Taking Action
- Page Likes
It’s not that this information is all worthless. It has value. But it’s information overload.
I prefer a report with a minimal number of columns focusing on your desired action.
For example, here are the columns I’d recommend for a Page Likes report:
- Start Date
- End Date
- Campaign
- Frequency
- Spend
- Page Likes
- Cost Per Page Like
That’s 10 fewer columns, and it focuses on the metrics that truly matter to the objective of your campaign (Page Likes).
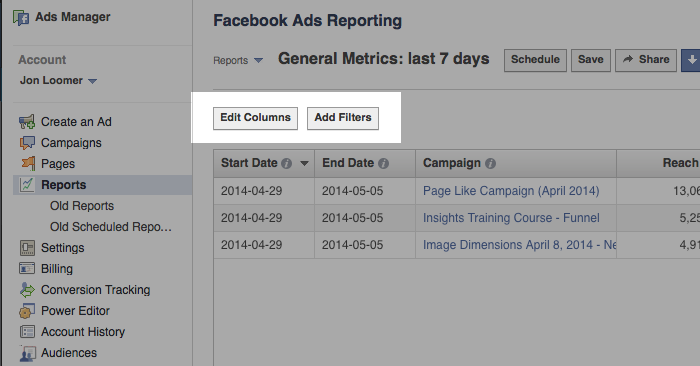
Edit Columns
You can take control of your ad reports with the help of a simple button: Edit Columns.
It’s at the top left of your report, next to the Add Filters button…
Click that beautiful button and you’ll get a dialog that looks like this…

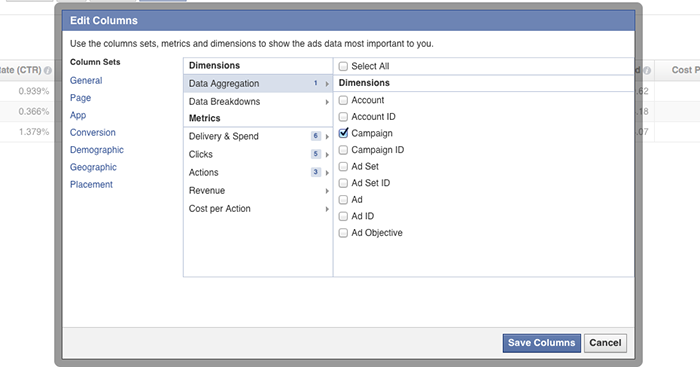
By my count, there are 148 different columns you could choose for your report. That’s a lot!
Of course, you don’t want all of them. You shouldn’t even want 17 of them. But the right data should be available to you depending on the type of report you want to run.
You just need to find it!
Data Breakdowns
The true goldmine — and the motivation behind this blog post — is found in the Data Breakdowns section.
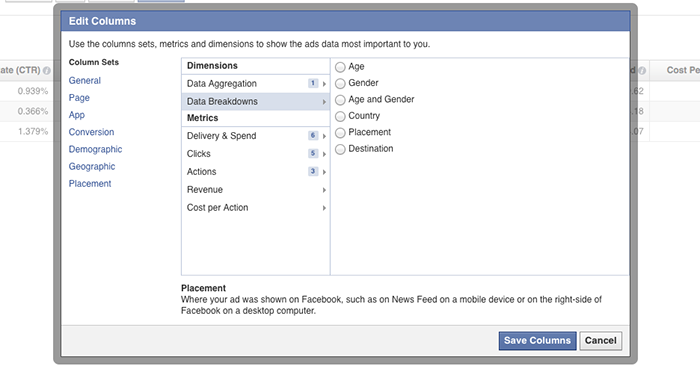
By default, Facebook doesn’t select any of this data. That’s why most advertisers don’t know it exists!
But click on any one (you can only select one at a time) and see how your ad is performing based on…
- Age
- Gender
- Age and Gender
- Country
- Placement
- Destination
Add a column for age…

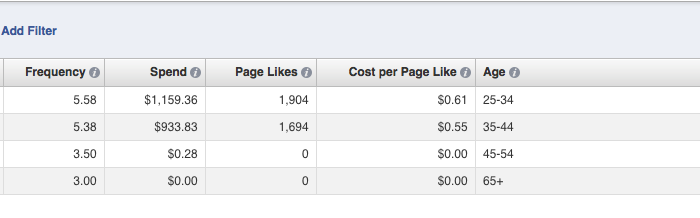
Facebook will break down performance based on the age of your audience:
- 13-18
- 18-24
- 25-34
- 35-44
- 45-54
- 55-64
- 65+
As you can see in the example above, I was focusing on the ages of 25-44 and getting the most success from the 35-44 age group.
Add a column for gender…

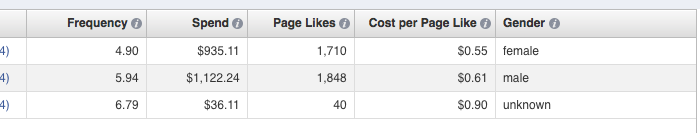
Facebook will break down performance based on the gender of your audience:
- Male
- Female
- Unknown
I was seeing the best results from women, though it’s not a significant difference.
Add a column for age and gender…

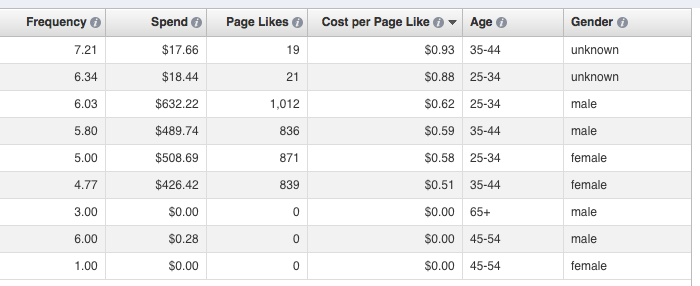
Facebook will break down performance based on the age and gender of your audience:
- Male 13-18
- Male 18-24
- Male 25-34
- Male 35-44
- Male 45-54
- Male 55-64
- Male 65+
- Female 13-18
- Female 18-24
- Female 25-34
- Female 35-44
- Female 45-54
- Female 55-64
- Female 65+
- Unknown 13-18
- Unknown 18-24
- Unknown 25-34
- Unknown 35-44
- Unknown 45-54
- Unknown 55-64
- Unknown 65+
In the example above, the unknown and male groups tended to be most expensive, while I was getting the best results from women aged 35-44.
Add a column for country…

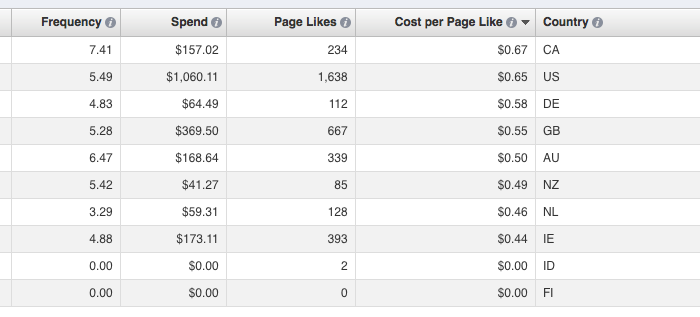
Facebook will create a column for countries, generating a row for each country served an impression. In my example above, it’s most expensive to get Page Likes in Canada and US and cheapest in the Netherlands and Ireland.
My favorite option, however, is adding a column for placement…

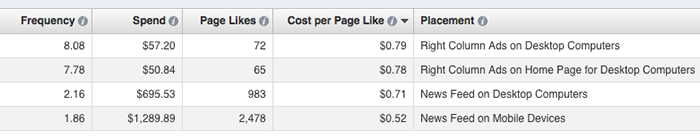
Facebook will break down performance based on the placement of your ad:
- Right Column Ads on Desktop Computers
- Right Column Ads on Home Page for Desktop Computers
- News Feed on Desktop Computers
- News Feed on Mobile Devices
As you can see in my results above, I’m getting the best Cost Per Page Like in this report on mobile devices. This has not always been the case. It’s why you constantly monitor your results!
Finally, you can add columns for destination. Facebook will highlight where someone went as a result of your ad. This could be your page, a custom tab or a link.
Save Your Reports!
Once you’ve created this awesomely helpful report, it’s important that you save it for later. Otherwise, Facebook won’t keep it for you, and you’ll need to start over every time!
Click the Save button…
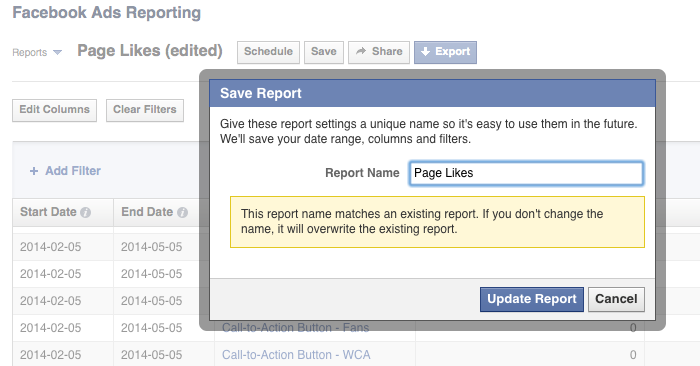
Name it something you’re remember later.
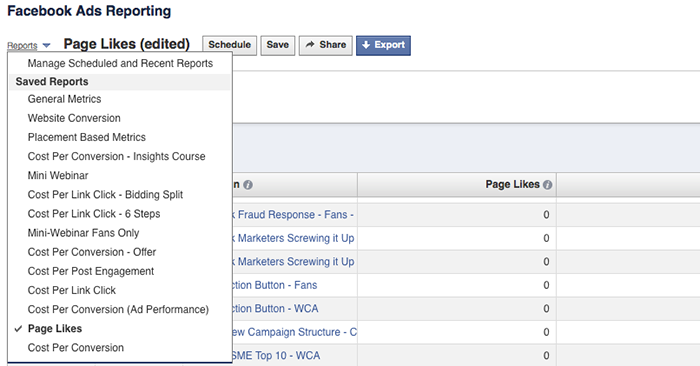
Every time you come back to your ad reports, Facebook will show you that same, lame, default report. But your saved reports will be available within the Reports drop-down at the top.
Your Turn
The Edit Columns button within your Facebook ad reports will save you a whole lot of time and money if used appropriately.
Are you using these reports? How are you using them? Let me know in the comments below!