

[AUDIO VERSION: I also recorded an audio version of this blog post. Click below to listen. Let me know if this is something you find helpful!]
One tool that not nearly enough Facebook advertisers are using is the custom ad reports. No, not the default campaign reporting Facebook gives you. And simply clicking on the “Reports” link doesn’t cut it either.
In fact, once you click on that link within Ads Manager, you’ll get a default report that is pretty darn worthless…

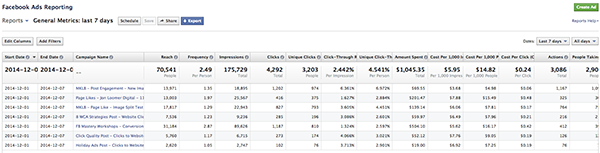
It’s a single report for every campaign you’ve been running for the past seven days, consisting of 17 columns worth of data. It’s not helpful.
But once you dig in — and I mean truly dig in — you’ll find gold. This is the information that will help you learn about what actually works and doesn’t work. And it will allow you to optimize your advertising for success.
I’m obsessed with Facebook ad reports, and I’m determined to make sure that other advanced advertisers use it. It’s why I made it one of the focuses of my FB Mastery Workshops.
If you haven’t used these custom ad reports yet, use this checklist to get started. Even if you have, it’s likely you haven’t done each of these 19 things…
1. Edit Columns
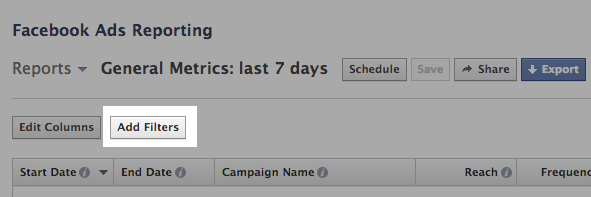
To unlock the gold found within Facebook’s custom ad reports, click the “Edit Columns” button on the left…

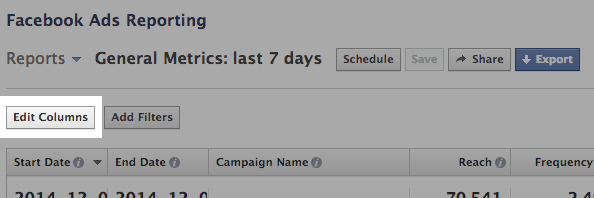
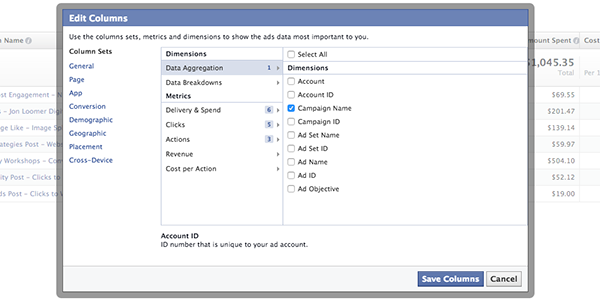
Then you’ll see a dialog that looks like this…

2. Use Filters
Chances are good that when you run your reports — especially if it’s for more than a few days — they will include data for campaigns that you don’t want to see at that time. For example, if you create a report for website conversions, you won’t want to see results for campaigns that used the Page Likes objective.
This kind of stuff can be cleaned up by using filters. Click the “Add Filters” button next to the “Edit Columns” button…

You can create filters based on the following:
- Campaign Name
- Ad Set Name
- Ad Name
Your filter can be that your campaign name, ad set name or ad name…
- Contains
- Does Not Contain
- Is
- Is Not
In other words, you are entering a name that is or isn’t in the campaign, ad set or ad name so that you can include only specific campaigns within your reports.
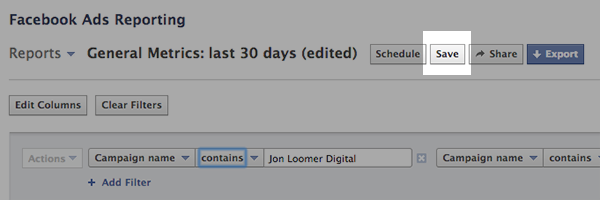
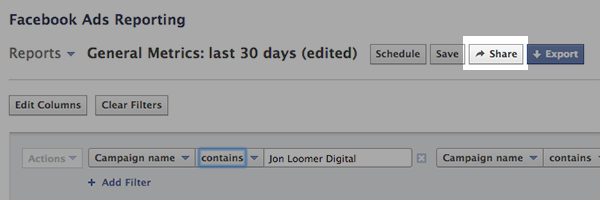
For example, I only want to see results for the Jon Loomer Digital page. So I add a filter for contains “Jon Loomer Digital” in the campaign name…

Or maybe I only want to see campaigns that were run for page likes, and I include the objective within my campaign titles (as you should!). I’d add a filter for contains “Page Likes” in the campaign name…

But what if I didn’t want results for any of my ad sets when targeting lookalikes? Well, I include the name of the target audience within the ad set name, so that’s easy. I’d add a filter for does not contain “Lookalikes” in the ad set name…

For any of these filters to work appropriately, you need to have a good naming convention for your campaigns, ad sets and ads. Be descriptive — and be consistent!
3. Save a Report
What can be annoying about Facebook’s ad reports is that you’ll customize a great report, but as soon as you leave that page you’ll lose everything. If you want that information again, you’ll need to completely recreate it.
That is, assuming you didn’t save it!
Once you’ve created a report that you think you’ll need later, click the “Save” button…

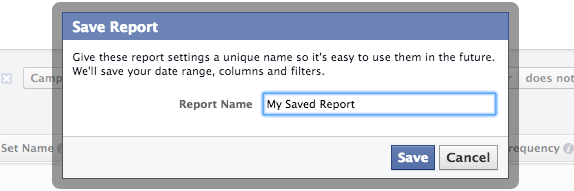
Then name it something descriptive so you’ll remember what it is later…

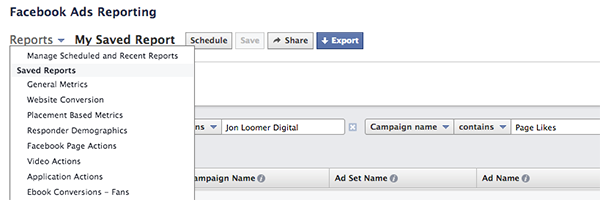
Then when you want to access it, simply click on the down arrow by “Reports” at the top to get a menu of saved reports (including some default reports that Facebook generates for you)…
4. Share a Report
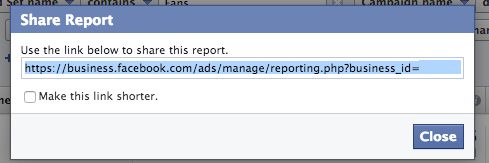
Now that you’ve saved a report, you can share it with a co-worker or client. Simply click the “Share” button at the top…
You’ll then be given a link that you can copy and share with your colleagues.

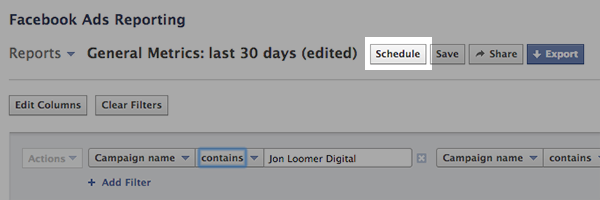
5. Schedule a Report
Maybe there is a report that you want emailed to you and your team on an ongoing basis. Click the “Schedule” button on the right…
You can have your report emailed on a daily, weekly or monthly basis, starting on a date you determine.
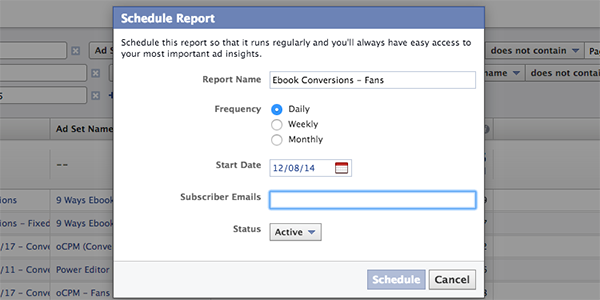
Enter everyone’s email address, and your entire team will receive this report when they need it!
6. View 2 Days Per Row
By default, Facebook will show you results for the past seven days. Each row will show all results by campaign, ad set or ad for that period.

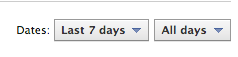
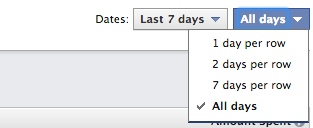
An obscure little option here, though, is to view results by the following:
- 1 day per row
- 2 days per row
- 7 days per row
- All days
By default, Facebook is showing you all days. Click the “All Days” drop-down, though, and you’ll get the other options.

Let’s say that you’re only viewing the results for one campaign (no ad sets or ads) during the past 14 days. By default, you’d see only one row showing you all selected columns of data for that campaign during those 14 days.
But if you select “2 days per row,” each row will cover a different two-day period. You’ll get seven rows in all, helping you spot trends in performance!
7. Add Column for Ad Objective
I typically include the objective (page likes, clicks to website, website conversions, etc.) within the campaign name, but not everyone does that. What if you wanted to see this information within your report?
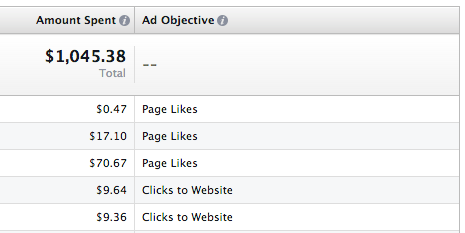
After clicking the “Edit Columns” button, check the “Ad Objective” box within Data Aggregation.
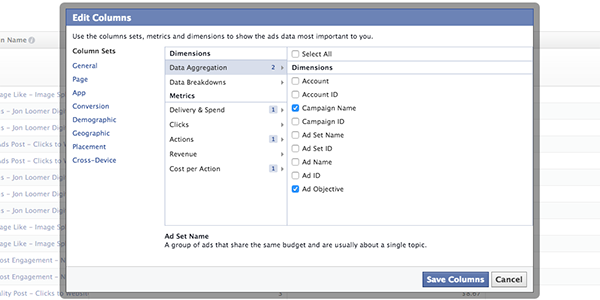
A column will then be added for your Ad Objective…

8. View Performance by Age
After clicking the “Edit Columns” button, go to Data Breakdowns. This is my favorite information found within Facebook ad reports!
By default, “None” is selected. But instead, select “Age.”
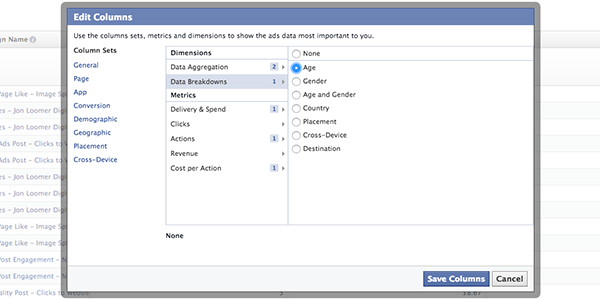
Facebook will now show a column for age so that you will be able to view results based on age group…

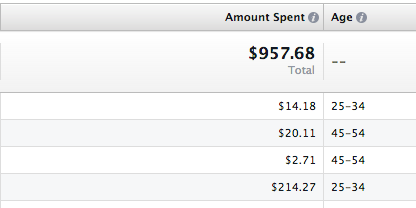
Facebook will then give you results for the following age groups (assuming they were reached with your advertising):
- 13-17
- 18-24
- 25-34
- 35-44
- 45-54
- 55-64
- 65+
This can be very useful when determining your cost per conversion, for example, depending on the age of your audience. I know many advertisers will create different ad sets by age to split test, but thanks to Facebook ad reports this isn’t always necessary.
9. View Performance by Gender
You can also have Facebook generate a column for gender…
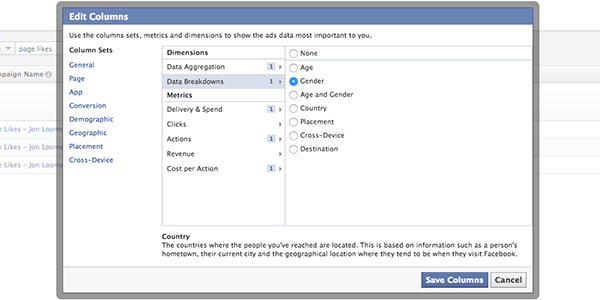
Facebook will then generate a column for gender…

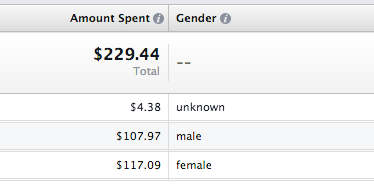
Your results will now be split up, giving you rows for Male, Female and Other. This can be very useful when determining whether men or women respond more or less favorably to your advertising.
10. View Performance by Age and Gender
Sure, maybe you already determined that women respond best to your ads. And maybe you know that the 25-34 age group is your sweet spot. But that age group also includes men. You can split that out!
Have Facebook generate columns for age and gender…
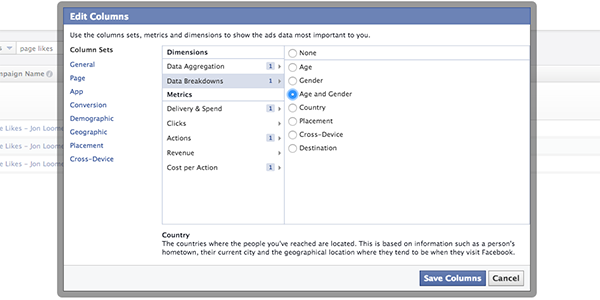
You’ll then get two new columns, one for age and one for gender…

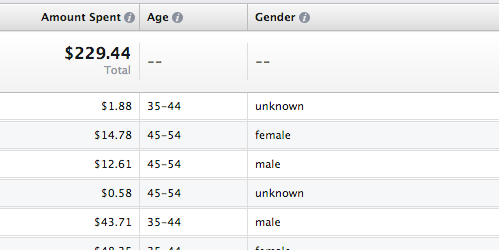
Your results will now be split up even further, giving you a row for each age group mentioned earlier for each gender (including Other).
11. View Performance by Country
Does performance of your ads differ by country? It’s very likely!
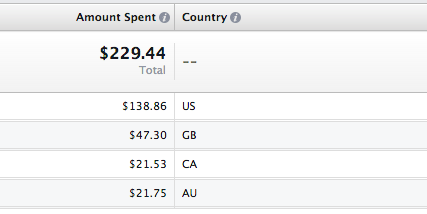
Have Facebook generate a column for country…
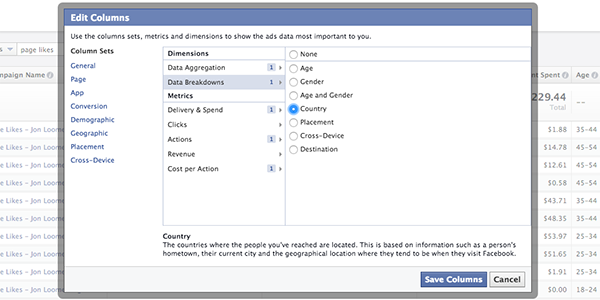
In addition to getting a column indicating the country targeted, you will now get a separate row for each country to keep those results separate.

Do you create different ad sets by country? You may not need to!
12. View Performance by Placement
If you don’t manually change your placement within ad sets, Facebook will show your ads across desktop news feed, mobile and right column. But do you ever wonder how your ads performed in each placement?
Some people will create separate ad sets to figure this out. But you don’t need to.
Have Facebook generate a column for placement…
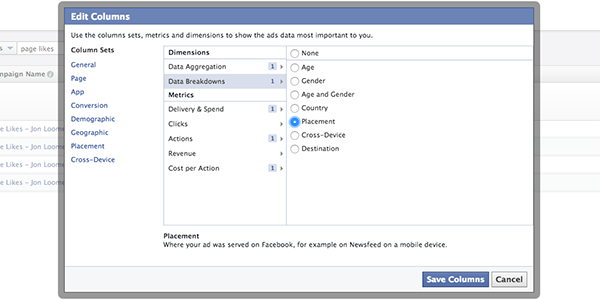
Facebook will then break apart performance depending on where it was shown — one column per placement…

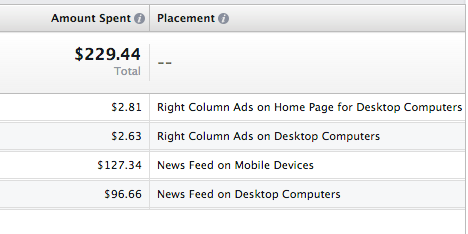
Placements include the following:
- News Feed on Desktop Computers
- News Feed on Mobile Devices
- Right Column Ads on Desktop Computers
- Right Column Ads on Home Page for Desktop Computers
As you can see, Facebook splits apart right column ads to differentiate between when your ads are shown on the home page (next to the news feed) and on all other pages.
13. View Cross-Device Performance
A nice addition that Facebook made recently was for cross-device reporting. Have Facebook add a column for cross-device…
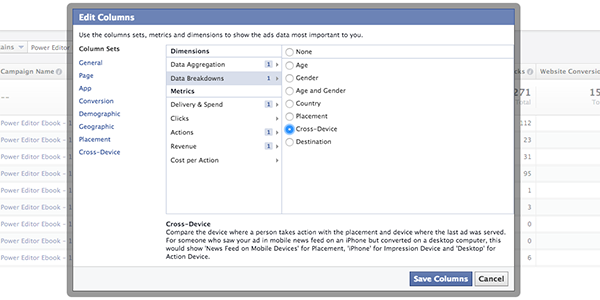
Note that this is mainly for conversion reporting. Some data will not be available for cross-device reports.
Facebook will then generate three new columns for cross-device reporting…
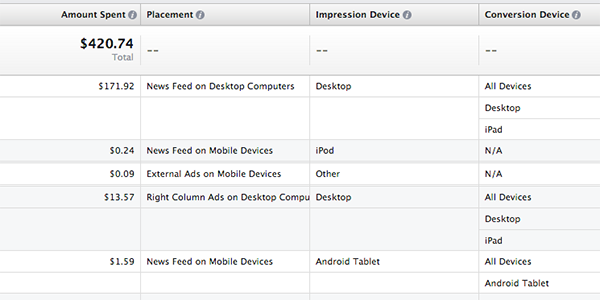
What does this mean? Facebook is helping answer the following questions for you:
- On what device were users when they saw your ad?
- On what device were users when they converted?
- Are these results the same?
It’s quite possible that users are seeing your ad on a mobile device, but later converting from their desktop. This will help you see if that change is being made.
14. View Performance by Destination
You may want to break down performance based on destination. For example, maybe you split tested sending users to different landing pages within the same campaign. For example, maybe one ad went to a Facebook tab and another to your website.
Have Facebook add a column for destination…
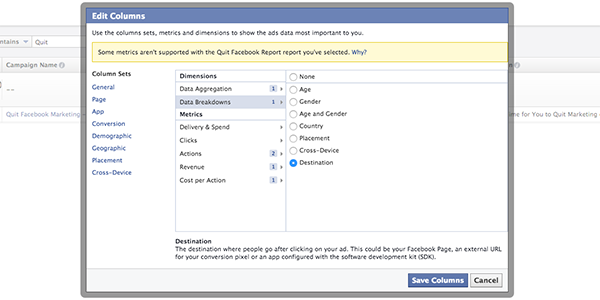
Facebook will then show you results based on where users went after clicking your ad…

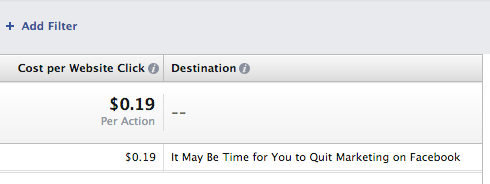
If they went to a page on your website, Facebook will pull the title from that page. Otherwise, it may be the name of your Facebook page or application.
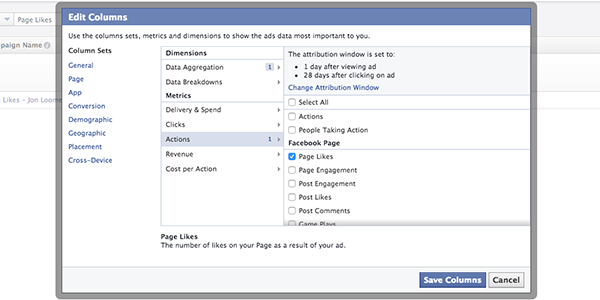
15. Change the Attribution Window
Most advertisers don’t realize this, but Facebook reports actions (including conversions) as follows:
- 1 day after viewing ad
- 7 days after clicking on ad (previously 28)
So if you are running a campaign that tracks conversions, for example, Facebook will — by default — tell you how many people converted based on those settings. The definition of a “conversion” includes far more than users who clicked and immediately converted.
But this also includes things like page likes and website clicks. I’m fine with this for conversions in particular, but you can change this.
While viewing Actions within Edit Columns, you’ll see at the top that the attribution window is set as described above.
Click the “Change Attribution Window” link.
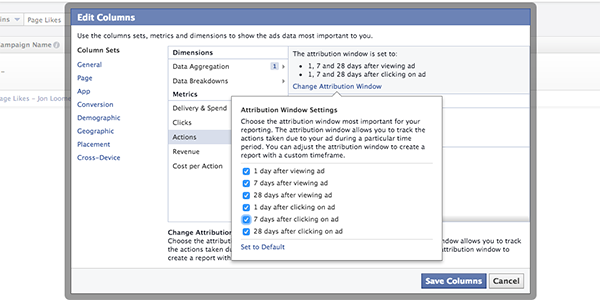
You’ll now have the following options (image created before removal of 28-day click attribution):
- 1 day after viewing ad
- 7 days after viewing ad
- 28 days after viewing ad
- 1 day after clicking on ad
- 7 days after clicking on ad
- 28 days after clicking on ad
Your results will then be split out depending on how many of the actions were performed within those attribution windows.

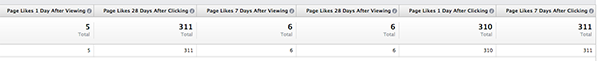
One of my page like campaigns broke down as follows:
- 1 day after viewing ad: 5
- 7 days after viewing ad: 5
- 28 days after viewing ad: 5
- 1 day after clicking on ad: 310
- 7 days after clicking on ad: 311
- 28 days after clicking on ad: 311
To help you understand this, note that this campaign generated 316 total page likes. So while 310 people liked my page within 1 day of clicking my ad, 311 did within 7 and 28 days. That just means that one more person liked my page within a day or more following that first click.
[adrotate banner=”43″]
16. Create a Page Likes Report
You should know your way around these ad reports now, so it’s time that you create some saved reports that you can put to good use.
Use the following base settings for a Page Likes report:
- Add Filter: Campaign Name Contains “Page Likes”
- Delivery & Spend: Amount Spent
- Actions: Page Likes
- Cost Per Action: Cost Per Page Like
In order for the filter to work, of course, you’ll need to use a naming convention that includes the objective within the campaign name.
Note that this is a base report — it is as basic as can be so that you aren’t distracted unnecessarily by metrics that may not matter.
Of course, you may want to add on data aggregation columns and a few others later. But I like to start with the base and then edit my saved report later.
Some other columns you may need:
- Data Aggregation: Ad Set Name
- Data Aggregation: Ad Name
- Delivery & Spend: Frequency
- Delivery & Spend: Cost Per 1,000 Impressions
17. Create a Clicks to Website Report
Use the following base settings for a Clicks to Website report:
- Add Filter: Campaign Name Contains “Clicks to Website”
- Delivery & Spend: Amount Spent
- Actions: Website Clicks
- Cost Per Action: Cost Per Website Click
Once again, this is very basic to start and the filter will only work if you include the objective within the campaign name. Some other columns you may need:
- Data Aggregation: Ad Set Name
- Data Aggregation: Ad Name
- Delivery & Spend: Frequency
- Delivery & Spend: Cost Per 1,000 Impressions
- Actions: Website Conversions
Even though these ads weren’t run with the objective of a website conversion, I often track them anyway.
18. Create a Video Views Report
Use the following base settings for a Video Views report:
- Add Filter: Campaign Name Contains “Video Views”
- Delivery & Spend: Amount Spent
- Actions: Clicks to Play Video
- Cost Per Action: Cost Per Clicks to Play Video
Once again, this is very basic to start and the filter will only work if you include the objective within the campaign name. Some other columns you may need:
- Data Aggregation: Ad Set Name
- Data Aggregation: Ad Name
- Delivery & Spend: Frequency
- Actions: Video Views
- Actions: Average Duration of Video Viewed
- Actions: Average Percentage of Video Viewed
- Actions: Website Clicks
- Actions: Website Conversions
When running Facebook video ads, you may be using a CTA button that drives users to a website to perform a conversion. In that case, you may need more columns.
19. Create a Website Conversion Report
Use the following base settings for a Website Conversions report:
- Add Filter: Campaign Name Contains “Website Conversions”
- Delivery & Spend: Amount Spent
- Actions: Website Conversions
- Cost Per Action: Cost Per Website Conversion
- Revenue: Website Conversion Value
Once again, this is very basic to start and the filter will only work if you include the objective within the campaign name. Some other columns you may need:
- Data Aggregation: Ad Set Name
- Data Aggregation: Ad Name
- Delivery & Spend: Frequency
- Delivery & Spend: Cost Per 1,000 Impressions
- Clicks: Click-Through Rate (CTR)
- Actions: Website Clicks
I’ll occasionally include CTR and Website Clicks to help me determine if there’s a disconnect between my ad and the landing page.
Your Turn
Note that I’m focusing on the core uses for Facebook ad reports. If you have a mobile app, desktop app, Facebook offer or event, the types of reports will vary.
Any other tasks you’d add to this checklist? Let me know in the comments below!