One of the most valuable and underutilized features in Ads Manager reporting is Breakdown. This feature requires no setup or planning. Yet, it can provide important insights that will shape your strategy.
In this post, we’ll walk through how you can breakdown your reporting by time, delivery, action, and dynamic creative element, and how you can act on that information. I’ll also highlight some of my favorite breakdownsBreakdown is a way to get insights into your ad performance related to time, delivery, action, or dynamic creative element. More.
Let’s go…
What is Breakdown?
From your Ads Manager, Breakdown is a drop-down menu on the right side.
When you use this feature, Facebook will breakdown your reporting by a single variable. The four categories within breakdown:
- Time
- Delivery
- Action
- Dynamic Creative Element
Note that Dynamic Creative Element doesn’t appear when you’re viewing from the campaignThe campaign is the foundation of your Facebook ad. This is where you'll set an advertising objective, which defines what you want your ad to achieve. More level.
Let’s walk through what you can do with each one…
Breakdown by Time
Let’s start with the Time breakdown.
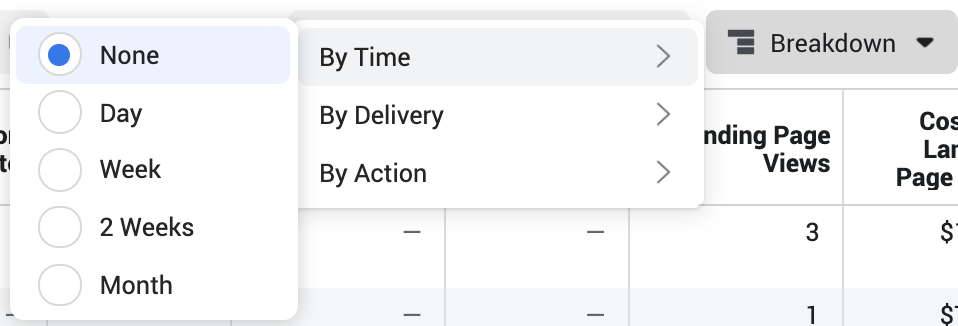
By default, Facebook doesn’t use a breakdown by time. But you can choose to breakdown your results by the following time periods:
- Day
- Week
- 2 Weeks
- Month
Let’s use “Day” as an example. When you select the Day breakdown, Facebook will create a different row for each day within the time window of your report.
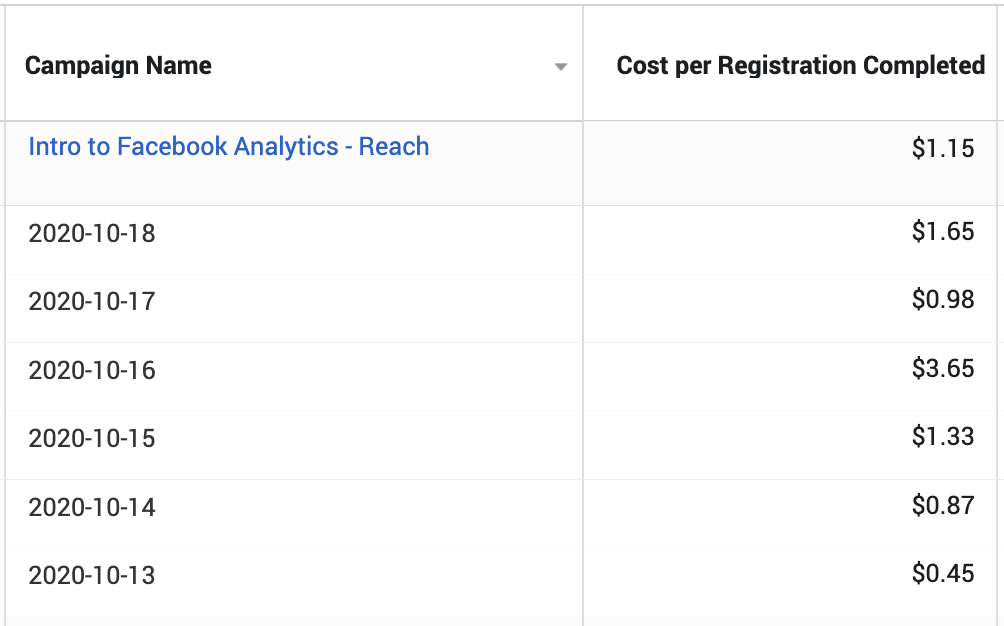
This is a good way to visualize the daily trends and volatility of costs. Because of the daily volatility, trends from longer time periods provide more valuable insight — particularly if it’s a long-running campaign.
Let’s breakdown a campaign by week.
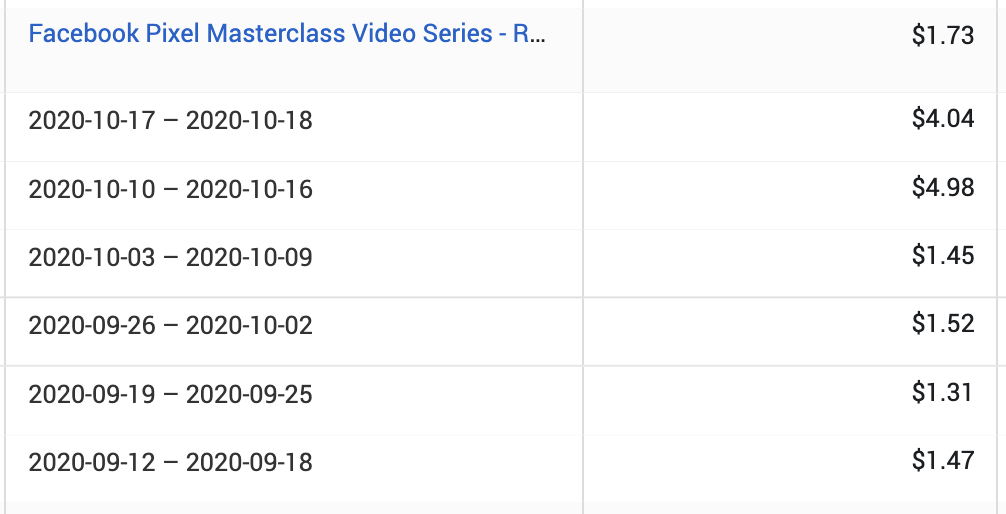
In this example, you can visualize costs abruptly rising during the past couple of weeks, signaling that it may be time for a change.
Breakdown by Delivery
Next up is the Delivery breakdown, where you’ll find a bunch of options…
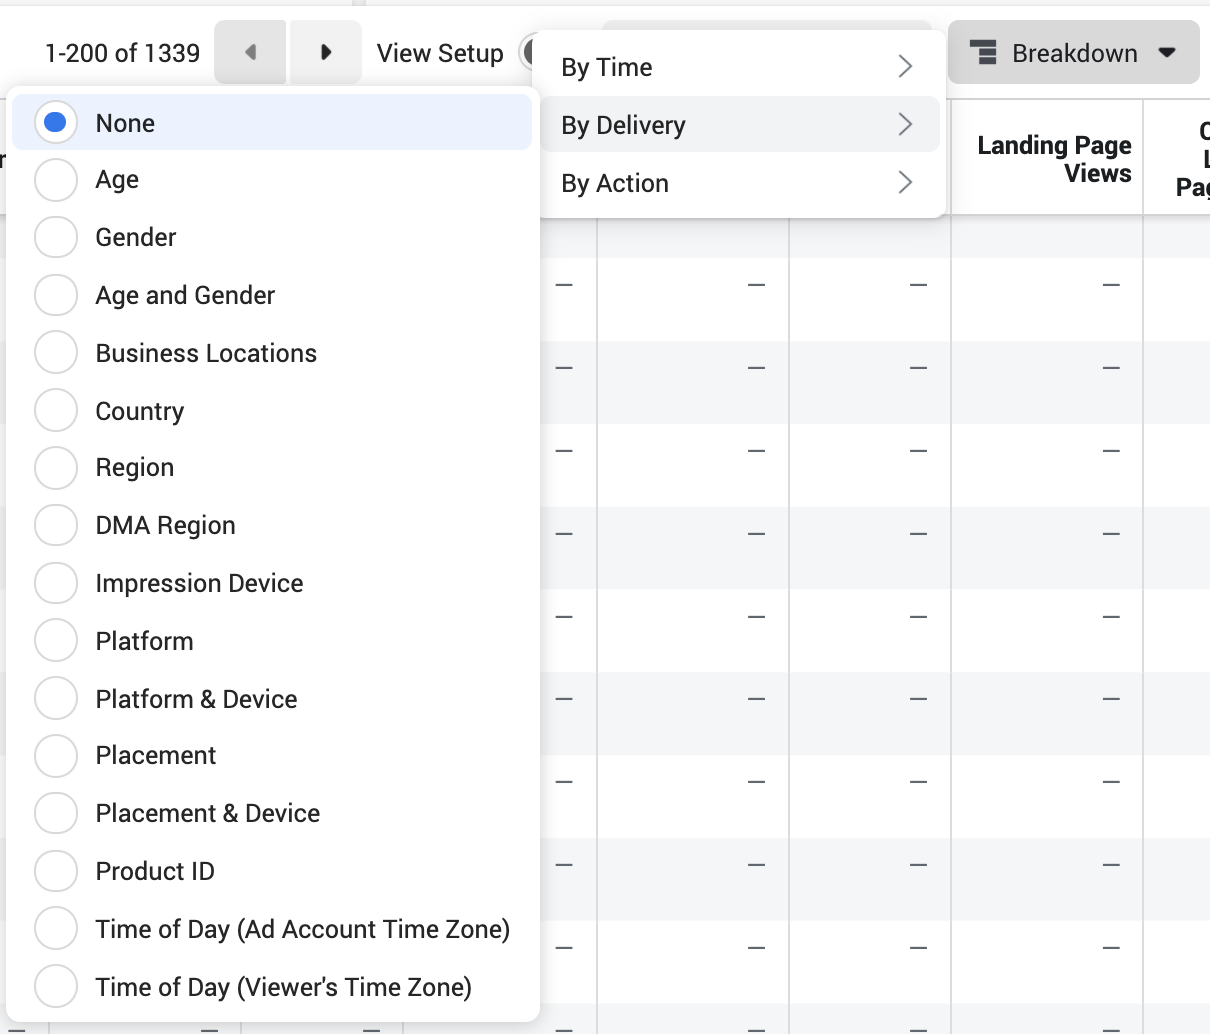
Once again, Facebook doesn’t use a breakdown by default. But you can choose to breakdown your results by the following:
- Age
- Gender
- Age and Gender
- Business Locations
- Country
- Region
- DMA Location
- Impression Device
- Platform
- Platform & Device
- PlacementA placement is a location where your ad is shown. Examples include Facebook's mobile Feed, Messenger, Instagram feed, Audience Network, right-hand column, and more. More
- Placement & Device
- Product ID
- Time of Day (Ad Account Time Zone)
- Time of Day (Viewer’s Time Zone)
Some clarifications on a few of these…
Business Locations: This is only available if you use dynamic page location targetingDefault location targeting will include anyone living in or recently in your home country. You can target and exclude locations by country, state, region, city, zip code, and more. In 2023, Meta removed options to target people only living in, traveling in, or recently in a location. More, where Facebook surfaces your ads from your business location closest to the targeted audienceThis is the group of people who can potentially see your ads. You help influence this by adjusting age, gender, location, detailed targeting (interests and behaviors), custom audiences, and more. More.
Region: Such as state or province.
DMA Region: Designated Marketing Area (like a metro TV market in the US).
Impression Device: Android smartphone, iPhone, desktop, iPad, etc..
Platform: Facebook or Instagram.
Product ID: Only available when using a product catalog.
Let’s look at a few examples of how you can use this.
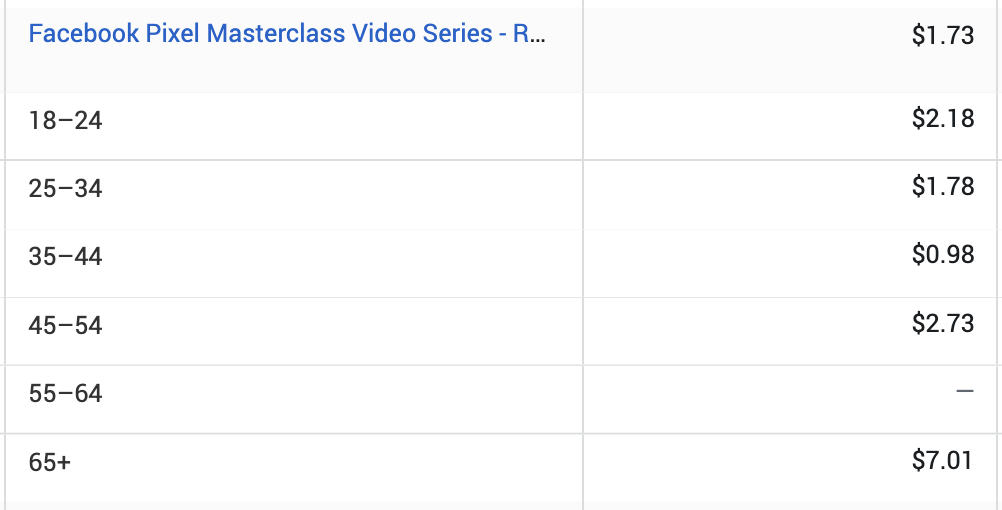
First, breakdown by age. Facebook automatically splits up results by age group. In the example below, I may be wasting money on the over-54 age group.
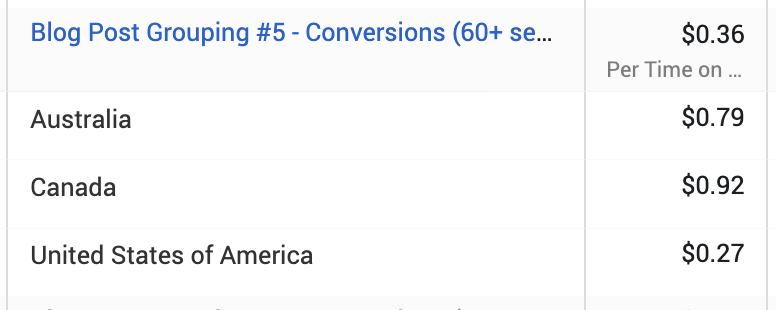
Here’s a breakdown by country. Here, you can spot where you may be wasting money or not dedicating enough budgetA budget is an amount you're willing to spend on your Facebook campaigns or ad sets on a daily or lifetime basis. More. If you aren’t focusing on specific countries, you may want to check where the impressionsImpressions are the number of times your ads were displayed to your target audience. Impressions aren't counted if it is detected they came from bots. More are going.
Now, let’s breakdown by placement. In this example, it’s costing far more for a registration on mobile web. That said, Facebook is doing a good job of spending less there.
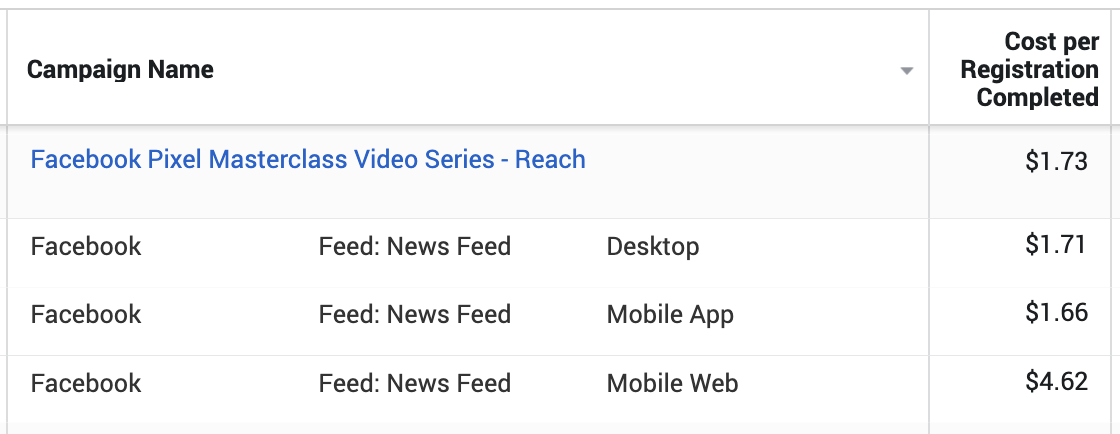
This is a good one to check, along with breakdown by country, if you are getting results that seem too good to be true. If you aren’t limiting your placements (and optimizing for something other than purchases), you may get inflated numbers from placements like Audience NetworkAudience Network is a network of mobile apps that have been approved to monetize their apps with ads. This is how you can show your Meta ads to people while they are away from the Meta family of apps. Audience Network and associated groups are among your placement selection options in the ad set. More.
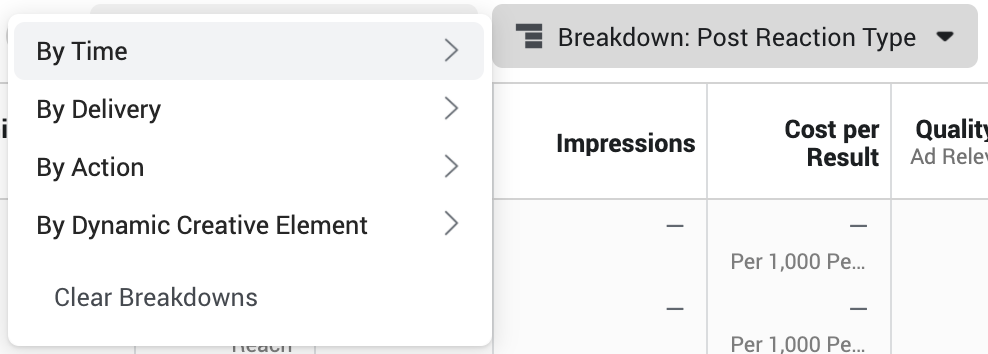
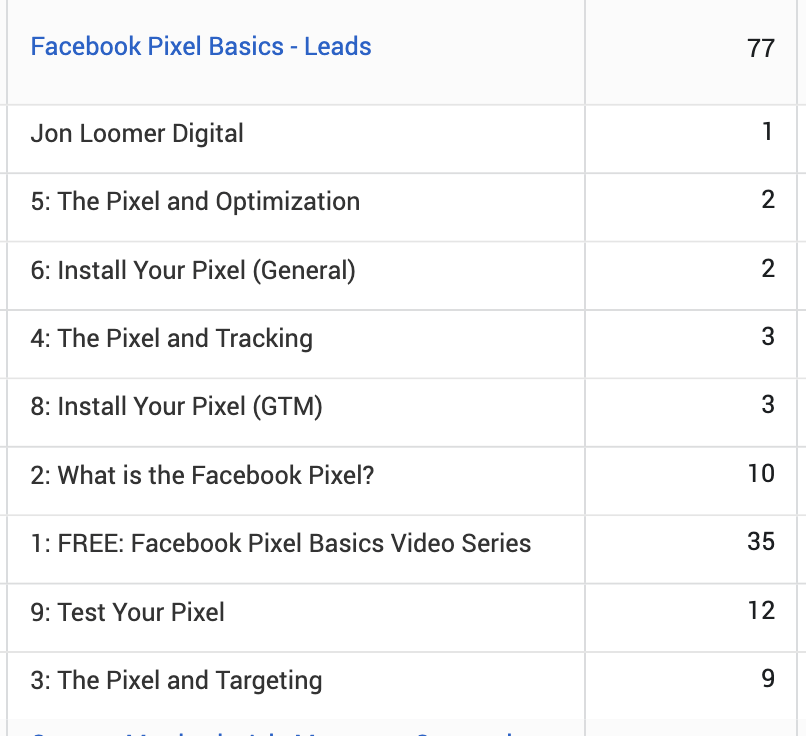
Breakdown by Action
We can also breakdown by Action…
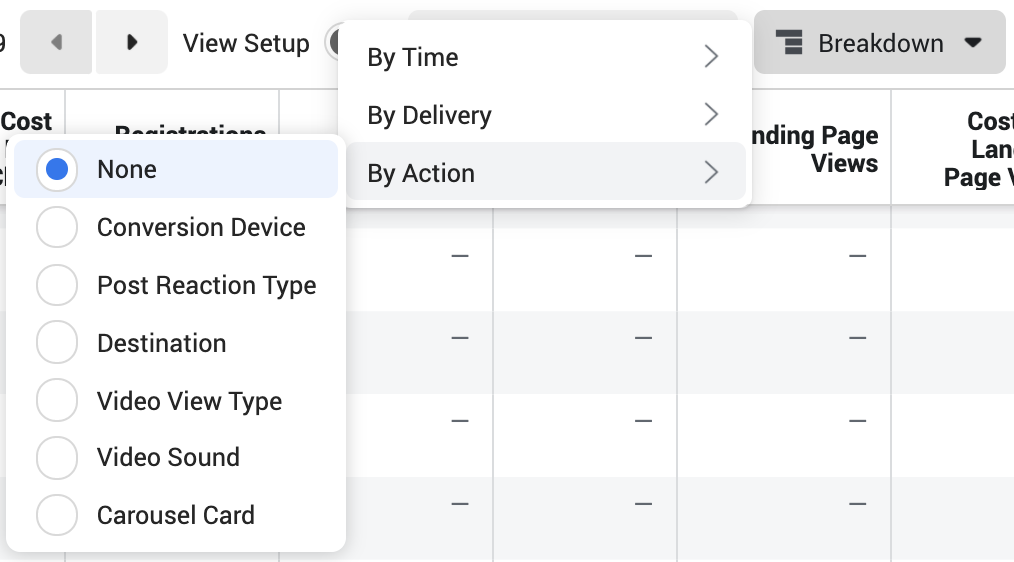
You can choose to breakdown your results by the following actions:
- Conversion Device
- Post Reaction Type
- Destination
- Video View Type
- Video Sound
- CarouselA carousel allows you to display two or more scrollable images or videos in the same ad, with the ability to link each to a different URL. More Card
- Instant Experience Component (only viewable at Ad level)
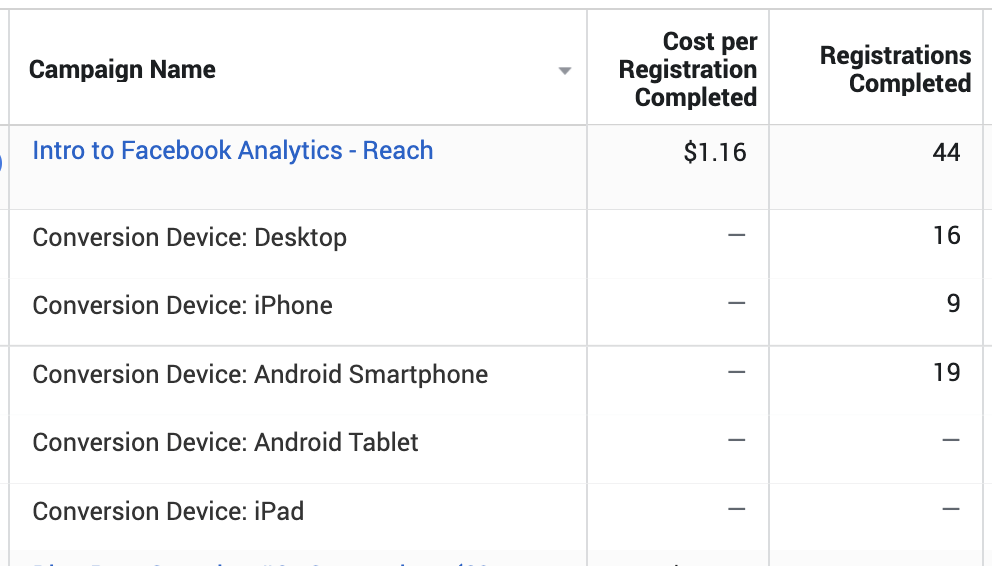
Conversion Device could be more valuable, but Facebook only breaks down the volume, rather than costs.
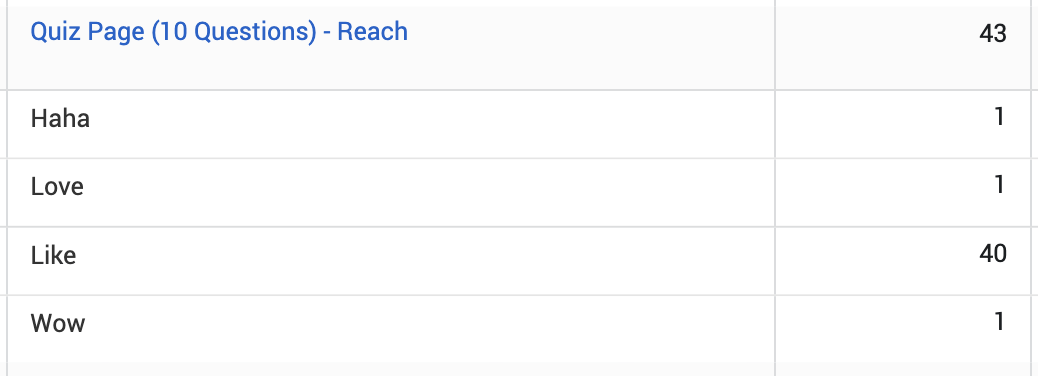
I’ll admit that I haven’t found value in the Post Reaction Type breakdown yet. If I view the Engagement report, it lists out the number of times each reaction was used. But not much else.
The Video View Type breakdown will separate auto-plays from clicked-to-plays.
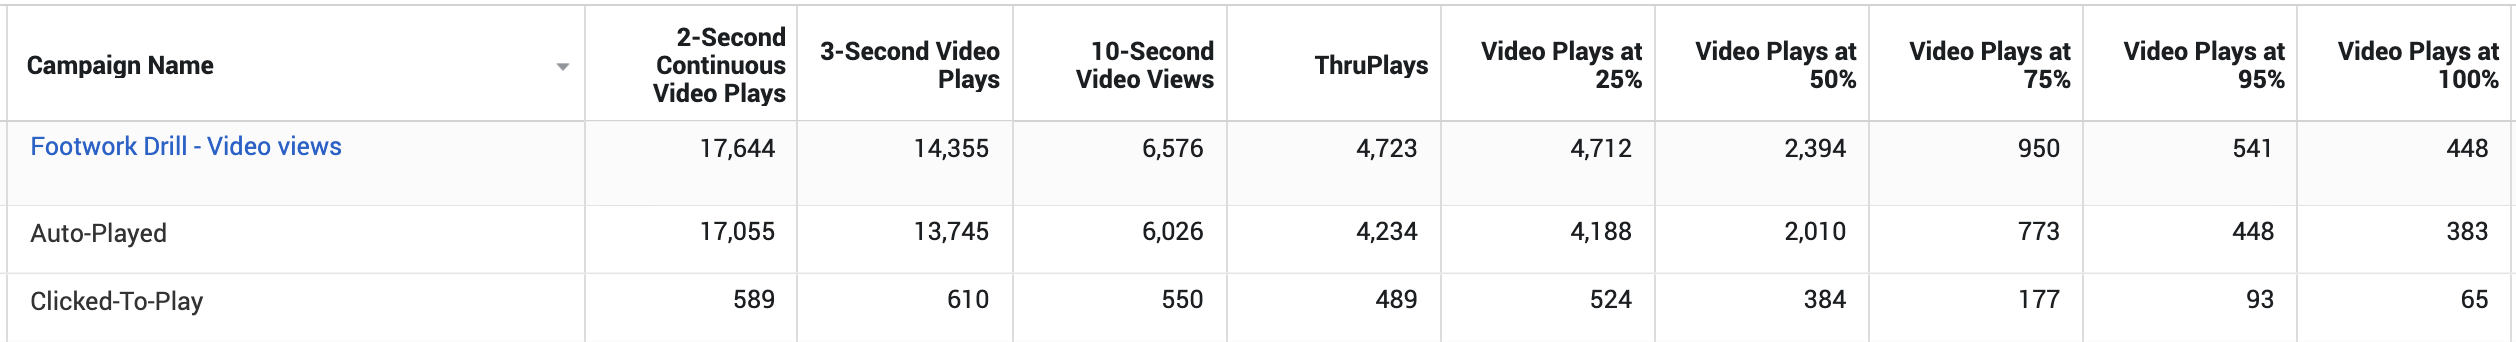
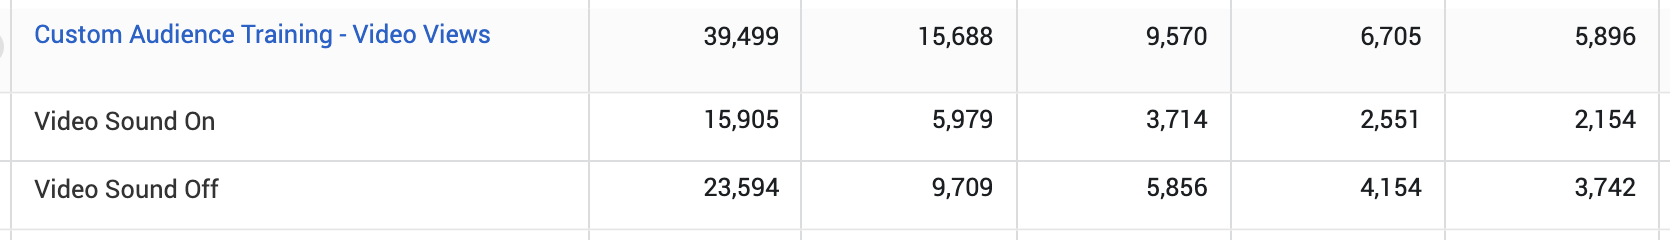
You can also breakdown video plays with and without sound.
If you use a carousel, you can breakdown clicks by carousel card to get a sense of which card generates the most engagement.
Dynamic Creative Element
Finally, you can breakdown by Dynamic Creative Element. Note that you won’t see this option if viewing from the campaign level.
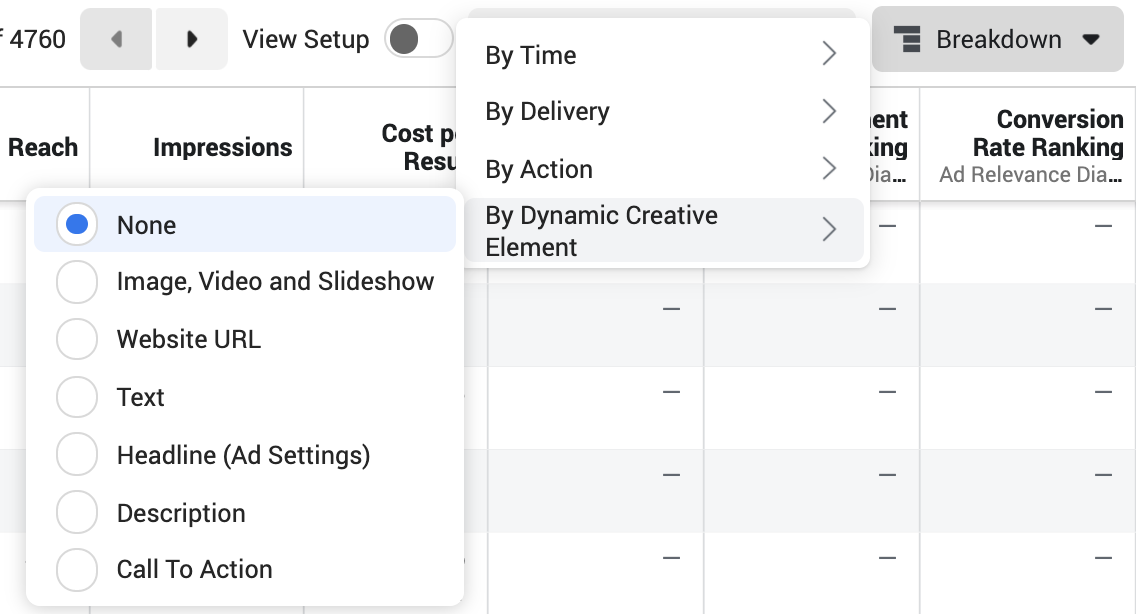
You can choose to breakdown your results by the following elements:
- Image, Video, and Slideshow
- Website URL
- Text
- Headline
- Description
- Call-to-ActionA call-to-action is a button or link on your ad that suggests the action you want your audience to take. Examples: "Learn More" or "Sign Up." More
I’m often asked how to view your results and see what’s working best when using Dynamic Creative. This is it. Select an element to separate the variataions you generated for each creative type.
My Favorite Breakdowns
There are a ton of options here, but some of my favorite breakdowns are as follows…
1. Day or Week Breakdown.
You can’t overreact to short-term results. It’s also easy to lose track of what your normal results are for a campaign. Breaking down by day or week is a really good way to track how your results are trending.
2. Country Breakdown.
I typically select a small number of countries when creating an ad setAn ad set is a Facebook ads grouping where settings like targeting, scheduling, optimization, and placement are determined. More. But there are times, particularly if an audience is especially small, that I might expand the number of countries or even use Worldwide. In these cases, I’ll keep a close eye on how my ads are being distributed by country and adjust if necessary.
3. Placement Breakdown.
If you use automatic placements and run ads for objectivesWhen you create a campaign, one of the first things you'll do is select an objective. The campaign objective is your ultimate goal. Your selection will impact options, including optimization and delivery. Options include Awareness, Traffic, Engagement, Leads, App Promotion, and Sales. More other than conversionsA conversion is counted whenever a website visitor performs an action that fires a standard event, custom event, or custom conversion. Examples of conversions include purchases, leads, content views, add to cart, and registrations. More, keep this one handy. If you ever see results that are too good to be true, check the distribution of budget and results by placement. I’ve found that Audience Network, in particular, can lead to accidental clicks or bot clicks. Those too-good-to-be-true results are often explained with this breakdown.
Your Turn
Do you use breakdowns? Do you have a favorite?
Let me know in the comments below!