One of the main struggles that my readers face as consultants is crafting effective Facebook advertising reports that they can send to their clients.
Luckily, Facebook has a powerful, customizable reporting system available. Unfortunately, the vast majority of advertisers don’t use it.
In this post, we’re going to focus on the following:
- What Custom Ad Reports Are
- What Clients Want vs. What They Need
- The Importance of a Campaign Naming Convention
- Page Likes Report for Clients
- Post EngagementPost engagements include all of the actions that people took on your Facebook ad post. Examples include:
• Post Shares
• Post Reactions
• Post Saves
• Post Comment
• Page Likes
• Post Interactions
• 3-Seconds Video Plays
• Photo Views
• Link Clicks
More Report for Clients - Website Clicks Report for Clients
- ConversionsA conversion is counted whenever a website visitor performs an action that fires a standard event, custom event, or custom conversion. Examples of conversions include purchases, leads, content views, add to cart, and registrations. More Report for Clients
- Schedule Reports
[Tweet “If you manage Facebook ads for clients, you need a system for sending monthly reports. Do this…”]
What Custom Ad Reports Are
If you aren’t using Facebook’s custom ad reports, you aren’t the only one. But it’s now been available for well over a year, and you’re running out of excuses!
If you manage your campaignsThe campaign is the foundation of your Facebook ad. This is where you'll set an advertising objective, which defines what you want your ad to achieve. More from the Ads Manager, you very likely use the standard reporting interface to view how you are doing on a campaign, ad setAn ad set is a Facebook ads grouping where settings like targeting, scheduling, optimization, and placement are determined. More or ad basis. But you only get the stats that Facebook gives you.
What you want is something more customized!
On the left hand side of Ads Manager, there’s a link for “Reports” and you’ll get a very generic report to start…
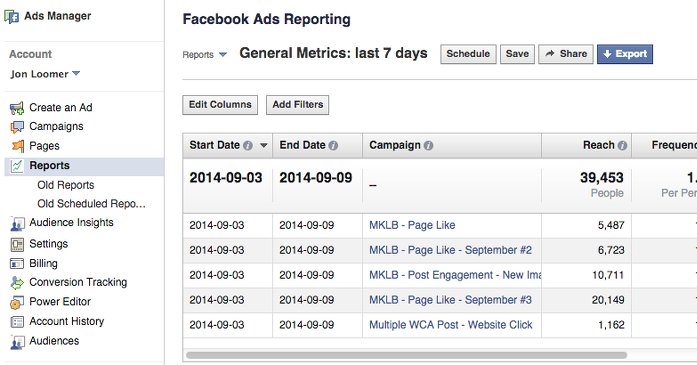
This report has 17 columns and isn’t particularly useful. But you can customize it by clicking the “Edit Columns” button.
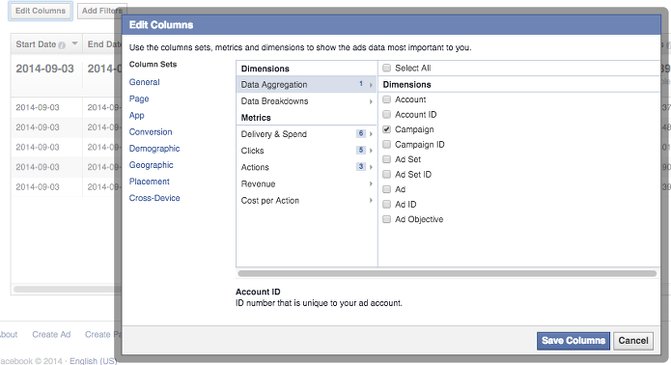
Once you select the stats you want, click “Save Columns.”
What Clients Want vs. What They Need
Most clients don’t know what they want in a report. Or they act like they do and ask for everything. You need to set expectations and provide structure.
Don’t allow them to be distracted by metrics that don’t matter. Create concise reports that are focused on a clear objective.
I recommend only sending reports at the end of each month. Things change quickly. Don’t allow the client to overreact while you are testing early in the process.
Assuming you run multiple campaigns for different objectivesWhen you create a campaign, one of the first things you'll do is select an objective. The campaign objective is your ultimate goal. Your selection will impact options, including optimization and delivery. Options include Awareness, Traffic, Engagement, Leads, App Promotion, and Sales. More, you should also be generating multiple reports. Following is an example of the reports you may provide:
- Page Likes Report
- Post Engagement Report
- Conversions Report
- Overview Report
Of course, if you’re running campaigns for mobile app installs, for example, you’ll want to run that report as well. It all depends on the work you are providing.
The Importance of a Campaign Naming Convention
Before we get started with creating these reports, it’s important that you follow a very important step. It’s critical that you have an effective naming convention for your campaigns.
You’ll soon see why this is so important. But get into the habit of including the following in the name of your campaigns:
- Name of Page
- Objective (Page Likes, Conversions, Post Engagement)
- Any Other Important Info (Product Promoted, Event)
Here’s an example of a campaign name:
Page Likes Campaign – Jon Loomer Digital – September 2014
The page name and objective will be important for filtering. I include the month for recurring campaigns (I always keep a Page Likes campaign running).
Page Likes Report for Clients
This is a basic report that should be run for most clients. It should capture the performance of all ads run for the sole purpose of increasing Page Likes.
After clicking the Edit Columns button, you’ll find that 14 metrics are selected by default:
- Delivery & Spend: ReachReach measures the number of Accounts Center Accounts (formerly users) that saw your ads at least once. You can have one account reached with multiple impressions. More
- Delivery & Spend: FrequencyCalculated as (Impressions/Reach), Frequency is a Facebook ads metric that measures the average number of times users have seen your ad. More
- Delivery & Spend: ImpressionsImpressions are the number of times your ads were displayed to your target audience. Impressions aren't counted if it is detected they came from bots. More
- Delivery & Spend: Cost Per 1,000 Impressions (CPMCPM measures the cost per 1,000 impressions. It's a good metric to evaluate competition level and costs to reach your audience. More)
- Delivery & Spend: Cost Per 1,000 People Reached
- Delivery & Spend: Amount Spent
- Clicks: Clicks
- Clicks: Unique Clicks
- Clicks: Click-Through Rate (CTR)
- Clicks: Unique Click-Through Rate (uCTR)
- Clicks: Cost Per ClickFacebook reports on CPC (All) and CPC (Link Click). The first refers to all clicks and the second on all internal and outbound links. More (CPC)
- Actions: Actions
- Actions: People Taking Action
- Actions: Page Likes
This report includes several metrics that marketers are in love with. Some are much less important than their reputation. And they simply aren’t necessary here.
We need to give your client the bare minimum. Avoid distractions. Check only the following:
- Delivery & Spend: Frequency
- Delivery & Spend: Amount Spent
- Actions: Page Likes
- Cost Per Action: Cost Per Page Like
While you can break it down by ad set or ad within “Data Aggregation,” I recommend you don’t. All the client needs to know is how efficiently your Page Likes campaign is building Page Likes.
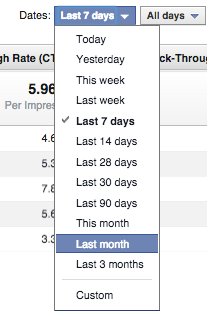
By default, your report displays data from the past seven days. I want you to change this to “last month.” There’s a filter at the far right to make this change:
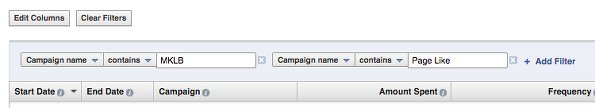
Your current report will now include all of the campaigns you ran last month. Now you’ll need to add a filter or several filters to only pull in the Page Likes campaigns for a specific client.
Click the “Add Filters” button and enter the following two filters:
- Campaign Name > Contains > [Name of Page]
- Campaign Name > Contains > Page Like
You can move the columns so that stats are in the order you prefer by grabbing the top row of a column and dragging it over.
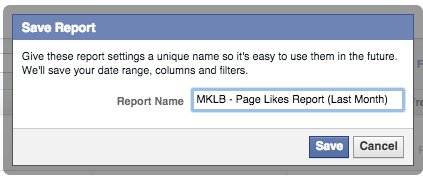
Next, save this report for access later by clicking the “Save” button. Make sure the name of that report is descriptive.
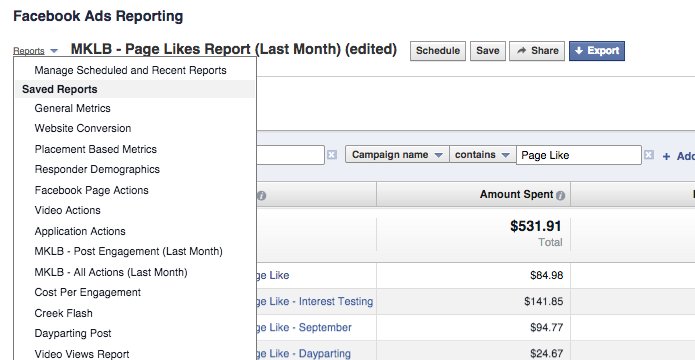
Note that this saved report is now available within the top left drop-down.
Post Engagement Report for Clients
Whether you boost a post through your page or promote it within the main ads interface or Power Editor (PREFERRED!), you should run a report that highlights these efforts.
Your goal here is typically to get some sort of post engagement (comment, post like, share).
- Delivery & Spend: Frequency
- Delivery & Spend: Amount Spent
- Actions: Post Engagement
- Actions: Post Likes
- Actions: Post Comments
- Actions: Post Shares
- Cost Per Action: Cost Per Post Engagement
Make sure to filter by the following:
- Page Name
- Post Engagement
Don’t forget to change the dates to “Last Month” and save your report.
Website Clicks Report for Clients
This is separate from the Post Engagement Reports for a reason. When you share a link, general post engagement is nice, but it’s not the objective. Your focus is on driving website traffic.
So for this report, let’s edit columns as follows:
- Delivery & Spend: Frequency
- Delivery & Spend: Amount Spent
- Actions: Website Clicks
- Cost Per Action: Cost Per Website Click
Make sure to filter by the following:
- Page Name
- Website Click
Don’t forget to change the dates to “Last Month” and save your report.
Conversions Report for Clients
This report will only work if you use conversion tracking so that Facebook can report on the number of conversions your campaigns are generating (one of the many reasons to use Conversion tracking!).
So for this report, let’s edit columns as follows:
- Delivery & Spend: Frequency
- Delivery & Spend: Amount Spent
- Actions: Website Clicks
- Actions: Website Conversions
- Cost Per Action: Cost Per Website Conversion
If you used multiple conversion types, you can choose those as well. Just be careful not to make this more complicated than is necessary.
Make sure to filter by the following:
- Page Name
- Website Conversion
Don’t forget to change the dates to “Last Month” and save your report.
Overview Report
Finally, you can create a master report that captures more data, just in case. This would be in the event that a client wants to know how many total page likes your campaigns generated, for example (including those that had objectives that weren’t for page likes).
- Delivery & Spend: Frequency
- Delivery & Spend: Amount Spent
- Actions: Page Likes
- Actions: Post Engagement
- Actions: Post Likes
- Actions: Post Comments
- Actions: Post Shares
- Actions: Website Clicks
- Actions: Website Conversions
Note that we don’t use Cost Per Action here since the results will be watered down and will appear worse than they are.
Make sure to filter by Page Name only.
Don’t forget to change the dates to “Last Month” and save your report.
Schedule Reports
Finally, let’s schedule these reports to be sent to both you and your client!
While viewing one of your saved reports, click on the “Schedule” button…
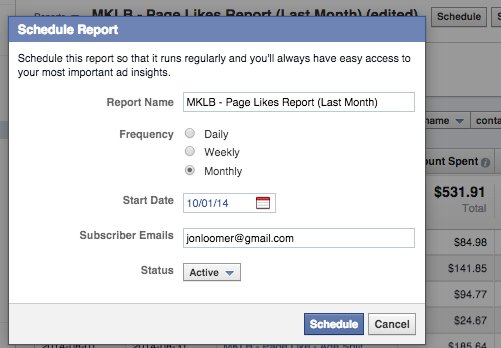
Next you’ll want to select “Monthly” for the frequency and pick a start date that is the first of the next month.
Finally, enter all email address of the people who need to receive that report. They’ll be emailed links to the export as well as the page for the report (they will need to have access to that page).
Your Turn
I didn’t cover every objective above (Photo Views, Video Views, Mobile App Installs, Event RSVP, Offer Claims, etc.), but you get the picture.
How do you handle reports for your clients?
Let me know in the comments below!