[AUDIO VERSION: I also recorded an audio version of this blog post. Click below to listen. Let me know if this is something you find helpful!]
Cookie cutter articles are routinely written that proclaim that “the Facebook sidebar is a wasteland” or “mobile is where it’s at on Facebook.” They’re all wrong.
In this post, I’m going to explain why before presenting my own data to show you what I’m seeing regarding the evolution of CPMCPM measures the cost per 1,000 impressions. It's a good metric to evaluate competition level and costs to reach your audience. More costs and Cost Per Page Like by placementA placement is a location where your ad is shown. Examples include Facebook's mobile Feed, Messenger, Instagram feed, Audience Network, right-hand column, and more. More, dating back to August of 2013.
[Tweet “Facebook CPM and Cost Per Page Like are evolving, depending on placement. Check this out…”]
The Problem With Universal Truths
Reports come out regularly that give us an idea of the trending costs and performance of Facebook ads. They are interesting, but they are nothing more than a mash-up of hundreds of advertisers.
How much were those advertisers spending? What were they promoting? What were the sizes of their potential audiences? Were they using CPM, CPCFacebook reports on CPC (All) and CPC (Link Click). The first refers to all clicks and the second on all internal and outbound links. More or oCPM? Were their ads effective?
These reports are good for entertainment purposes. They can even provide a lightbulb moment, inspiring you to take a second look at your ads.
But do not let these reports guide your advertising habits. Focus on your results only.
The truth is that the Facebook advertising landscape is constantly evolving. Costs will go up and down based on competition. And what you see may not be what I see depending on industry, audienceThis is the group of people who can potentially see your ads. You help influence this by adjusting age, gender, location, detailed targeting (interests and behaviors), custom audiences, and more. More, copy, imagery and a long list of factors.
Using the RIGHT Data
Something else to consider is that advertisers are often distracted by the wrong data. Don’t be one of those advertisers.
For example, your Click Through Rate on the sidebar may be awful. It probably is. But it’s generally much, much cheaper to reachReach measures the number of Accounts Center Accounts (formerly users) that saw your ads at least once. You can have one account reached with multiple impressions. More users in the sidebar, too.
In the end, the only metric that truly matters is your Cost Per Desired Action. Everything else can cloud the picture and lead you down the wrong path.
Back in November…
I’ve heard more times than I can count that you shouldn’t advertise on Facebook’s sidebar. In fact, I’d estimate that 9 of 10 advertisers I talk to completely ignore it in favor of the News Feed.
But I’ve found that the sidebar works just fine. In fact, back in November I reported seeing that the sidebar was more effective than mobile for getting page likes, registrations and even sales.
As with everything, things change. It’s why I suggest that you constantly monitor your results to optimize based on what is working and what isn’t.
My Data
I decided to pull all of my results dating back to August of 2013. The reason I selected this starting point is based on sample size. I started investing close to a minimum of $2,000 per month starting in August.
I ran two reports to get a better handle on costs based on placement. Know that you can run a similar report using your Facebook ad reports.
I first broke down the impressionsImpressions are the number of times your ads were displayed to your target audience. Impressions aren't counted if it is detected they came from bots. More and spend for all advertising by placement. On average, I spent the following per month:
- Desktop News Feed: $1,010.45
- Mobile News Feed: $714.22
- Desktop Sidebar: $169.26
Since competition will differ wildly depending on placement (I previously found that the cost to reach users on the sidebar was 1/20 of Desktop News Feed and 1/50 of mobile), I then found the CPM for each placement.
Next, I focused only on my page like ads run during these months to track the cost of a page like by placement over time.
Following is my average ad spend for page likes per month, by placement:
- Desktop News Feed: $385.03
- Mobile News Feed: $367.35
- Desktop Sidebar: $92.72
As you can see, I spend about 45% of my ad budgetA budget is an amount you're willing to spend on your Facebook campaigns or ad sets on a daily or lifetime basis. More on building a relevant audience.
My Advertising Habits
It’s first important to note that I use Optimized CPM almost exclusively.
If you aren’t familiar with oCPM, this is Facebook’s default bidding method. Facebook will optimize your audience, showing your ad to the people most likely to perform your desired action. Your bid is also dynamic, as Facebook will bid what is necessary to reach that audience (budget and audience size being important factors).
As a result of using oCPM, my CPM prices will always be significantly higher than advertisers who use manual bids. But I’m confident I also get the corresponding “optimized” results (see my study on using oCPM over CPM).
Additionally, I promote to audiences of varying sizes, from a few thousand to several million. The size of the audience will also impact the cost to reach those people.
Facebook CPM by Placement
You’ll recall that back in November, I saw a huge difference in CPM depending on placement. Let’s see how that has evolved since August…
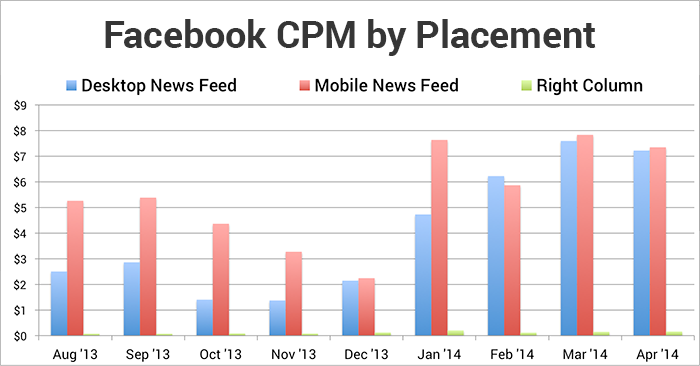
As you can see, I saw CPM drop steadily across all placements from August through December, but it then rose quite a bit beginning in January.
Previously, the cost to reach users on mobile devices was significantly higher than the cost to reach them in the desktop News Feed. Beginning in December (January being the exception) that is no longer the case for me. CPM for desktop and mobile News Feed is now nearly identical.
Average CPM for my ads by placement from August through December of 2013 was as follows:
- Desktop News Feed: $2.14
- Mobile News Feed: $4.36
- Desktop Sidebar: $.08
Average CPM for my ads by placement in 2014 is currently as follows:
- Desktop News Feed: $6.72
- Mobile News Feed: $7.49
- Desktop Sidebar: $.15
Note that CPM doubled for the sidebar, tripled for desktop News Feed, and nearly doubled for mobile. There are many explanations for this, and we shouldn’t apply a global rule.
I considered not reporting dollar figures at all since the ratio is actually most important. If I begin focusing on a smaller audience — or raise my budget for the same audience — oCPM prices are bound to increase. So I encourage you to focus more on the ratios.
It now costs me 45 times more to reach users in the desktop News Feed and 50 times more to reach users on mobile than the sidebar. In other words, the ratio remained steady for mobile News Feed vs. sidebar, but price of desktop News Feed has increased.
My Theory: Fewer users are accessing Facebook via desktop than ever before. Meanwhile, advertisers continue to favor this real estate. As a result of increased competition, prices are increasing for the desktop News Feed.
Cost Per Page Like by Placement
It’s costing me quite a bit more to reach users now than it was at the end of 2013. So how is this impacting my Cost Per Page Like?
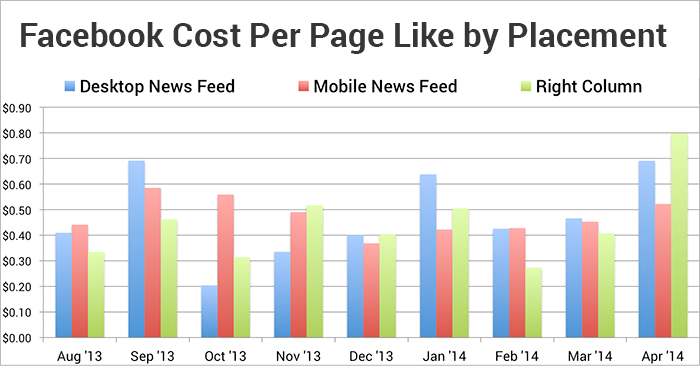
As you can see in the chart above, the cost of Page Likes has remained steady or even dropped on mobile; desktop News Feed is constantly evolving; and the sidebar is at an unacceptably high rate.
Here’s a breakdownBreakdown is a way to get insights into your ad performance related to time, delivery, action, or dynamic creative element. More of the average Cost Per Page Like by month from August through December of 2013:
- Desktop News Feed: $.40
- Mobile News Feed: $.49
- Desktop Sidebar: $.40
Desktop was most efficient for me, whether in the News Feed or sidebar.
Now let’s look at January through April of 2014:
- Desktop News Feed: $.55
- Mobile News Feed: $.44
- Desktop Sidebar: $.46
The median cost is a bit misleading given the way costs are trending for me. I’m currently seeing a cost of $.80 per Page Like in the sidebar, which I cannot continue to spend. Mobile is currently easily my most affordable placement.
Let’s also keep in mind that my ads may simply be less effective now. We can’t ignore that possibility. I continue to refresh them monthly. But generally, I’m seeing an increase in costs for Page Likes on desktop (especially for sidebar) while mobile is now more attractive.
Overall, while CPM has doubled or tripled for my ads, the cost for Page Likes has increased but not at that rate. Facebook advertising appears to be getting more competitive, but oCPM is optimized to the point where the increasing CPM costs are not resulting in huge increases in costs for Page Likes.
Reminder: A Word of Caution
Once again, these results are based on my advertising only. This is not meant to be a universal report on how Facebook advertising costs are trending.
This is what I am seeing based on the audience I target, the creative and copy I’m using and the budgets I set.
The bottom line here is that the landscape is constantly changing. Monitor your results to determine the best possible placement for your ads.
Your Turn
What results are you seeing? Is mobile becoming more affordable for you, too?
Let me know in the comments below!