Facebook has updated the ads reporting tool — a tool most advertisers don’t know even exists — to be incredibly useful.
The new tool allows you to quickly determine how a single ad performed by age, country and placementA placement is a location where your ad is shown. Examples include Facebook's mobile Feed, Messenger, Instagram feed, Audience Network, right-hand column, and more. More without having to split test with multiple ads. It also allows you to evaluate the performance of your ad based on Action metrics (conversions, for example) and cost per that action.
Go to facebook.com/ads/manage/reporting.php to access your reports.
If it looks like this…
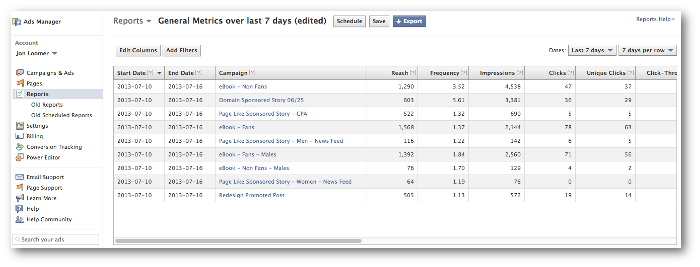
…it’s your lucky day! You have the new Facebook ad reports.
If it looks like this…
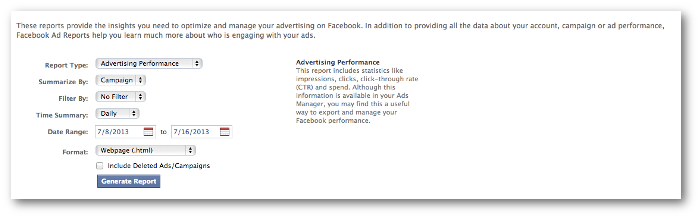
…sorry! You still have the old Facebook ad reports. You’ll need to wait for the new ones to be rolled out to you.
Regardless of whether or not you have the new Facebook ad reports yet, I’ve written this post to help you understand all of the awesome new features available within it.
This will be a top-level overview. I’ll write other posts in the future to provide more hands-on examples of how it can be used.
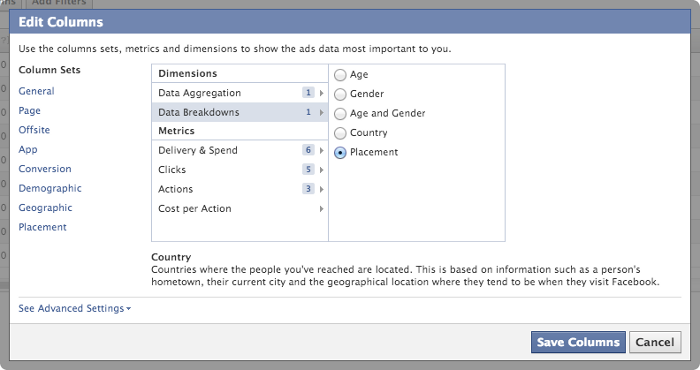
Edit Columns
One of the most exciting pieces of this new tool is the ability to edit precisely what information you want to be shown in a Facebook ads report.
With the Edit Columns feature, for example, you could compare the performance of ads based on the following:
- Placement of the Ad (News Feed, Desktop, Mobile, Sidebar)
- Gender
- Country
- Cost Per Page Like
- Cost Per Website Conversion
You couldn’t view all of these within the same report, but they are all available and extremely valuable.
Following are all of the various columns that are available to you…
Dimensions – Data Aggregation
This allows you to easily evaluate which campaignsThe campaign is the foundation of your Facebook ad. This is where you'll set an advertising objective, which defines what you want your ad to achieve. More or ads, for example, performed best. Probably best to at least keep the name of the ad within a column.
- Account
- Campaign
- Ad
- Account ID
- Campaign ID
- Ad ID
Dimensions – Data BreakdownsBreakdown is a way to get insights into your ad performance related to time, delivery, action, or dynamic creative element. More
Possibly the most exciting inclusion in this tool. You can only choose one of these per report, but this allows you to easily compare the Cost Per Action, for example, of ads based on age, gender, country and placement.
For example, you could create one ad that targets all placements. Then create a report to compare your Cost Per Action for Desktop News Feed, Mobile News Feed, All Desktop and the Desktop Sidebar.
With this information, you could then stop that original ad and then start a new one that uses those optimized specs.
I’m most excited about this because I notoriously create dozens of ads in my split testing to help determine this. It’s no longer completely necessary (split testingSplit testing (or A/B testing) allows you to test changes in Facebook variables like ad creative, audience, or placement to determine which approach performs best. More is still important for copy and imagery, however).
- Age
- Gender
- Age and Gender
- Country
- Placement
Metrics – Delivery & Spend
Include columns for the metrics you feel are important. In my opinion, most important here is Spend to keep other results relative.
- ReachReach measures the number of Accounts Center Accounts (formerly users) that saw your ads at least once. You can have one account reached with multiple impressions. More
- FrequencyCalculated as (Impressions/Reach), Frequency is a Facebook ads metric that measures the average number of times users have seen your ad. More
- ImpressionsImpressions are the number of times your ads were displayed to your target audience. Impressions aren't counted if it is detected they came from bots. More
- Social Reach
- Social Impressions
- Cost Per 1,000 Impressions (CPMCPM measures the cost per 1,000 impressions. It's a good metric to evaluate competition level and costs to reach your audience. More)
- Cost Per 1,000 People Reached
- Spend
Metrics – Clicks
Personally, I’m not particularly concerned about general clicks. You can select as many of these as you want. I tend to keep all unselected.
- Clicks
- Unique Clicks
- Social Clicks
- Click-Through Rate (CTR)
- Unique Click-Through Rate (uCTR)
- Cost Per Click (CPC)
- Cost Per Unique Click
Metrics – Actions
This is the good stuff! This is what determines success and failure of your campaign. Now, you may, however, want to skip this section and go directly to “Cost Per Action.” But including at least one of these columns could be important for perspective.
In general, you can select columns for:
- Actions
- People Taking Action
These actions can then be broken down by those associated with your Facebook Page, External URL, Application or Event.
If you create ads that drive users to an offsite landing page that drives some sort of conversion with an offsite pixel (purchase, lead, add to cart, etc.), this is extremely useful!
Facebook Page:
- Page Likes
- Page EngagementThe total number of actions users took on your Facebook Page and posts that were attributed to your ads. Page engagement can include liking your Page, reacting to a post, checking in to your location, clicking a link, and more. More
- Post EngagementPost engagements include all of the actions that people took on your Facebook ad post. Examples include:
• Post Shares
• Post Reactions
• Post Saves
• Post Comment
• Page Likes
• Post Interactions
• 3-Seconds Video Plays
• Photo Views
• Link Clicks
More - Post Likes
- Post Comments
- Post Shares
- Page Photo Views
- Page Video Plays
- Link ClicksThe link click metric measures all clicks on links that drive users to properties on and off of Facebook. More
- Offer Claims
- Check-ins
- Page Mentions
- Page Tab Views
- Question Answers
- Question Follows
External URL:
- Website Conversion
- Checkouts (Conversion)
- Registrations (Conversion)
- Leads (Conversion)
- Key Web Page Views (Conversion)
- Add To Carts (Conversion)
- Other Website ConversionsA conversion is counted whenever a website visitor performs an action that fires a standard event, custom event, or custom conversion. Examples of conversions include purchases, leads, content views, add to cart, and registrations. More
Applications:
- App Installs
- Mobile App Installs
- App Engagement
- App Story Engagement
- App Uses
- Credit Spends
- Mobile Purchases
Events:
- Event ResponsesThe number of people who responded 'Interested' or 'Going' to your Facebook event and credited to your ads. More
Metrics – Cost per Action
This is where you make and save money. For me, the true measure of success of an ad campaign comes down to Cost per Action.
Once again, this is broken down by actions associated with your Facebook Page, External URL, Application or Event.
Facebook Page:
- Cost per Page Like
- Cost per Page Engagement
- Cost per Post Engagement
- Cost per Post Like
- Cost per Post Comment
- Cost per Post Share
- Cost per Page Photo View
- Cost per Page Video Play
- Cost per Link ClickFacebook reports on CPC (All) and CPC (Link Click). The first refers to all clicks and the second on all internal and outbound links. More
- Cost per Offer Claim
- Cost per Check-in
- Cost per Page Mention
- Cost per Page Tab View
- Cost per Question Answer
- Cost per Question Follow
External URL:
- Cost per Website Conversion
- Cost per Checkout (Conversion)
- Cost per Registration (Conversion)
- Cost per Lead (Conversion)
- Cost per Key Web Page View (Conversion)
- Cost per Add To Cart (Conversion)
- Cost per Other Website Conversion
Applications:
- Cost per App Install
- Cost per Mobile App Install
- Cost per App Engagement
- Cost per App Story Engagement
- Cost per App Use
- Cost per Credit Spend Action
- Cost per Mobile Purchase
Events:
- Cost per Event Response
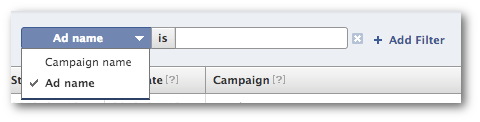
Ad Filters
You probably want to view only certain campaigns or certain ads within a campaign to keep any comparison relevant. For example, there’s no reason to compare a campaign aimed at getting Page Likes to one focused on offsite conversions.
So make sure you use your filters to select applicable ads and campaigns. You can create more than one filter if necessary…
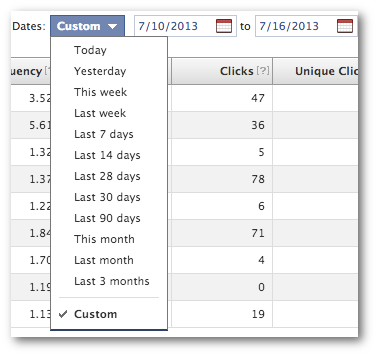
Dates
Do you want to view performance only during a specific period of time? Make sure you select the applicable dates to compare here…
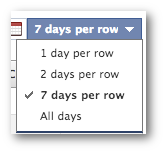
You can also determine how many days will apply to each row. Maybe you want all days to apply. But you can also break up an ad’s performance into seven day increments to see if it is trending in a positive or negative direction…
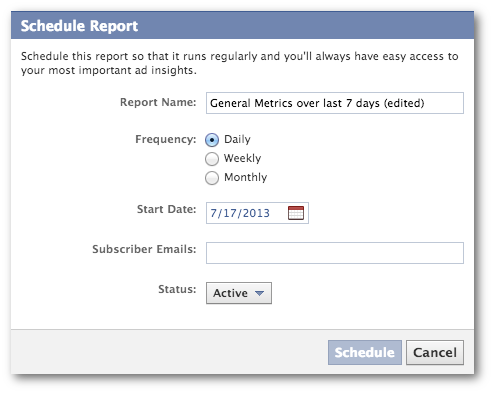
Schedule Reports
This is great for any advertisers who need to provide reports to clients or higher up — or for any advertiser who simply needs regular reminders regarding the performance of their advertising.
Choose how often these reports are generated and have alerts emailed to you when they are ready.
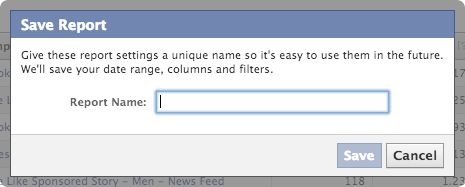
Save Report Settings
Do you have specific filters that you will use later? Save them! This is a great time saver.
More to Come!
Have you tried out the new Facebook Ad Reporting yet? This is an exceptional tool that will only get better. I am still experimenting with it and will provide more posts in the future with specific use cases to leverage these reports for your success.
Let me know how you’re using them in the comments below!